Texting vs. GPA
Graphs
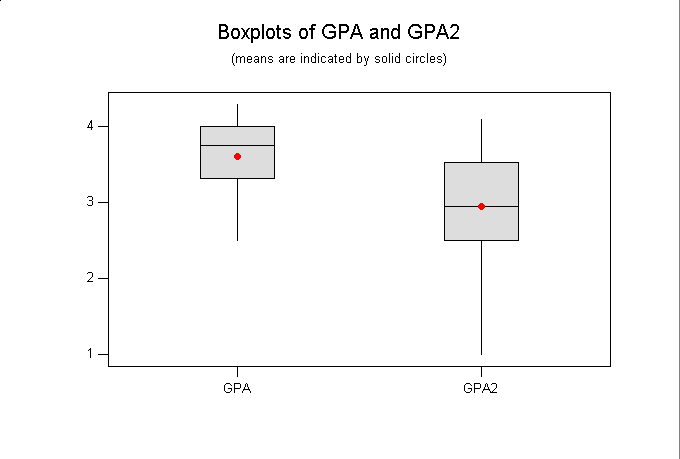
Boxplots comparing mean GPAs of students who do not text (GPA) versus the GPAs of students who do text (GPA2)
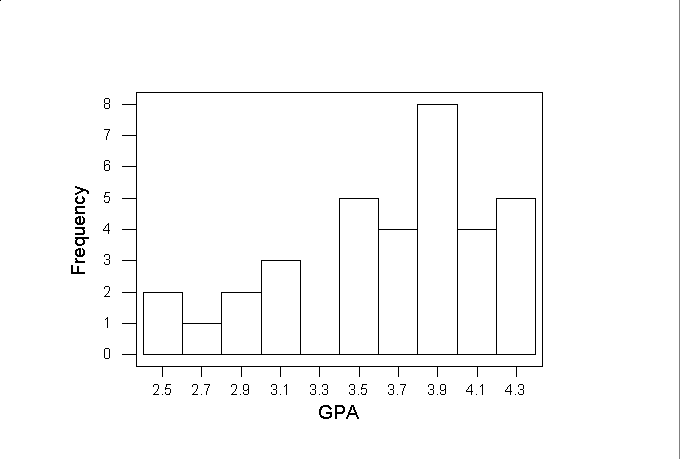
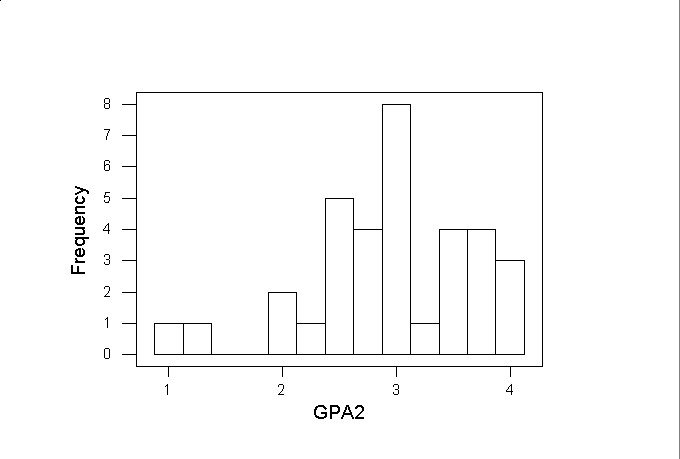
Graphs comparing the height and lay out of GPAs of students who do not text (histogram1) and GPAs of students who do(histogram2)


© 2006 Your Site
Site Design - DesignCreek
