


Graphs
*****
click on picture to enlarge
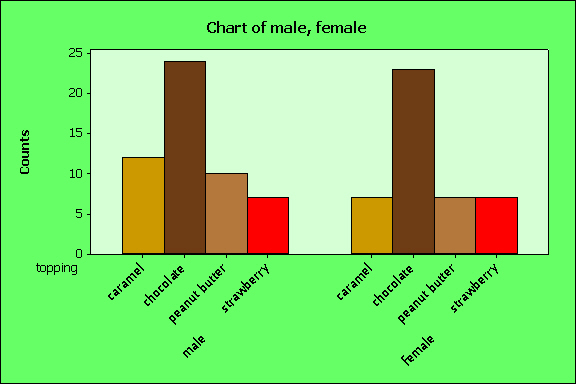
Descriptive Statistics: topping
Variable gender N N* Mean SE Mean StDev Minimum
topping2 female 44 0 1.4773 0.0762 0.5053 1.0000
male 53 0 1.5472 0.0690 0.5025 1.0000
topping2 female 44 0 1.4773 0.0762 0.5053 1.0000
male 53 0 1.5472 0.0690 0.5025 1.0000
Variable gender Q1 Median Q3 Maximum
topping2 female 1.0000 1.0000 2.0000 2.0000
male 1.0000 2.0000 2.0000 2.0000
topping2 female 1.0000 1.0000 2.0000 2.0000
male 1.0000 2.0000 2.0000 2.0000