Graphs
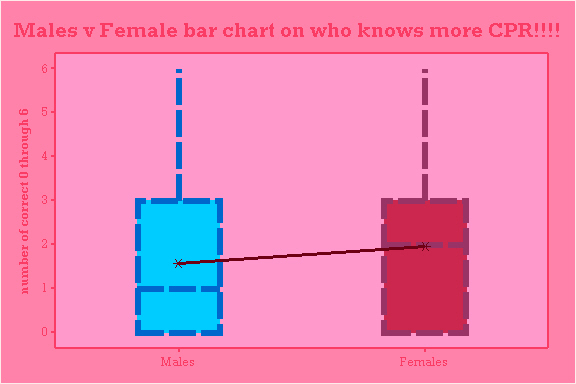
This is a bar graph that shows the mean!!! This shows that they both know about the same amount of information. The girls have a slightly higher mean.
 .
.
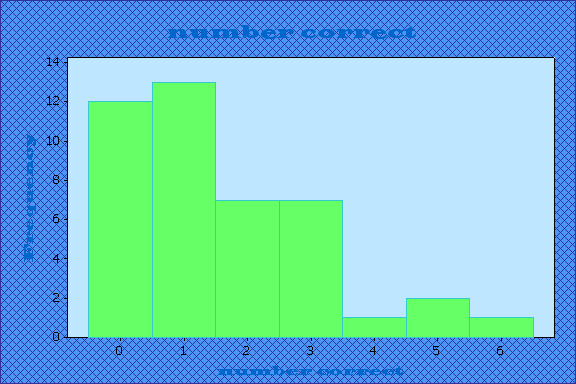
This is the male chart so say how many were correct and how often this occurred.
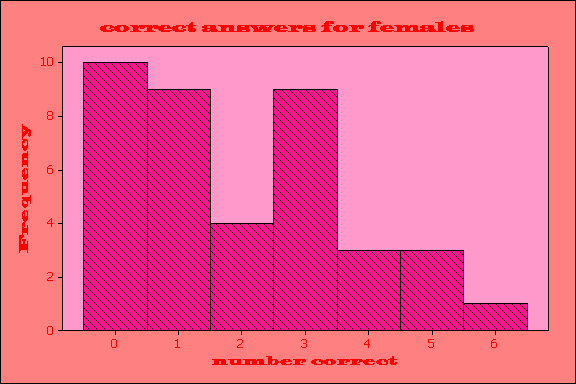
This is the girls graph about how often a girl got the number correct.