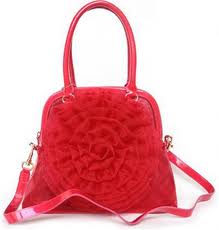
To choose our sample of girls to measure, we first got a
list of all the students attending North Olmsted High
School. We then took out all the males. After
achieving a list of all the females, which would be our
population of interest, then using random data samples
from columns in Minitab to randomly choose 100 girls
from the list. Once we had the list, we found their
schedules and found a period in which they could be
measured and then measured their purse.
| Weight |
Food |
| 0.6 |
N |
| 1.2 |
Y |
| 1.2 |
N |
| 1.4 |
N |
| 1.8 |
N |
| 1.8 |
N |
| 2 |
Y |
| 2.2 |
N |
| 2.2 |
N |
| 2.6 |
N |
| 2.7 |
N |
| 2.8 |
N |
| 2.8 |
N |
| 2.8 |
Y |
| 2.8 |
Y |
| 3.2 |
N |
| 3.2 |
N |
| 3.2 |
Y |
| 3.2 |
Y |
| 3.6 |
N |
| 3.6 |
Y |
| 3.8 |
Y |
| 4 |
Y |
| 4.2 |
N |
| 4.2 |
N |
| 4.4 |
Y |
| 4.4 |
Y |
| 4.4 |
Y |
| 4.6 |
N |
| 4.6 |
N |
| 4.6 |
Y |
| 4.6 |
Y |
| 4.6 |
Y |
| 4.8 |
Y |
| 4.8 |
Y |
| 4.9 |
Y |
| 5 |
Y |
| 5 |
Y |
| 5.1 |
Y |
| 5.2 |
N |
| 5.2 |
Y |
| 5.2 |
Y |
| 5.3 |
Y |
| 5.3 |
N |
| 5.4 |
N |
| 5.5 |
Y |
| 5.5 |
Y |
| 5.6 |
N |
| 5.7 |
Y |
| 5.7 |
Y |
| 5.8 |
N |
| 5.8 |
N |
| 5.8 |
Y |
| 5.8 |
Y |
| 5.9 |
Y |
| 6.2 |
N |
| 6.2 |
Y |
| 6.3 |
Y |
| 6.5 |
Y |
| 6.6 |
Y |
| 6.8 |
Y |
| 6.8 |
Y |
| 7 |
Y |
| 7.1 |
Y |
| 7.2 |
N |
| 7.2 |
Y |
| 7.2 |
Y |
| 7.3 |
Y |
| 7.5 |
Y |
| 7.6 |
Y |
| 7.6 |
Y |
| 7.8 |
N |
| 7.8 |
Y |
| 7.9 |
Y |
| 9.3 |
N |
| 9.6 |
N |
