G
raphs
Home
Background Research
The Study
Discussion
Conclusion
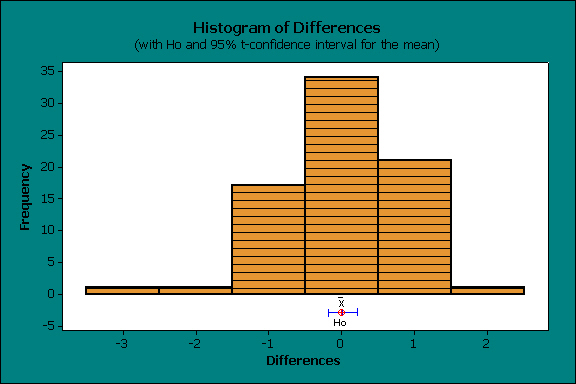
We showed the differences in our data by a histogram.
By: Stephen Newport & Nicole Horn
This histogram depicts that most of the data was centered around 0 and that there was variation.
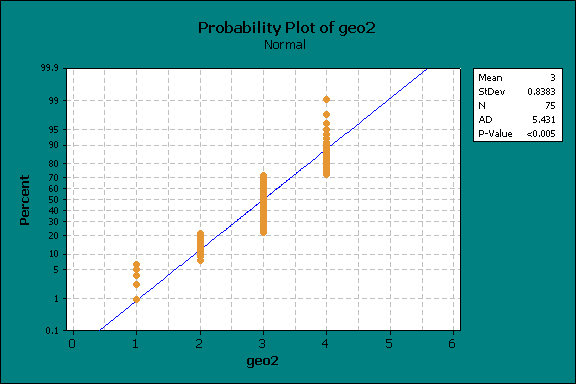
Our normality graphs showed us that our data was not totally normal.