Descriptive Statistics and Graphs
Variable
N N*
Mean SE Mean
StDev Minimum
Q1 Median
Q3
Democrats
49 0
3.166
0.120 0.840
1.240 2.650
3.400 3.826
Republicans 24
0 3.366
0.116 0.569
2.400 2.900
3.400 3.800
Neither
43
0 3.048
0.110 0.722
1.400 2.700
3.100 3.500
Variable
Maximum
Democrats
4.375
Republicans
4.250
Neither
4.280
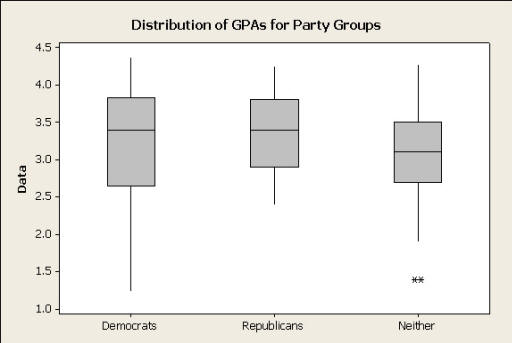
From the descriptive statistics and boxplot, one can conclude that the distributions are fairly similar. The means and medians are all fairly close.