Graphs and Statistics
Descriptive Statistics: Male, Female
Variable N N* Mean SE
Mean StDev Minimum Q1 Median Q3 Maximum
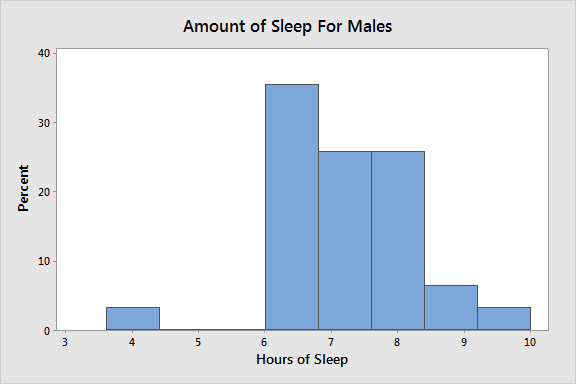
Male 31 0 7.094 0.194 1.080 4.000 6.500 7.000 8.000 9.500
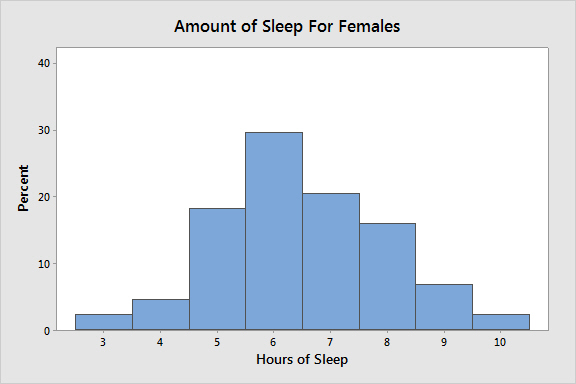
Female 44 0 6.375 0.223 1.479 3.000 5.250 6.000 7.375 10.000

