Graphs
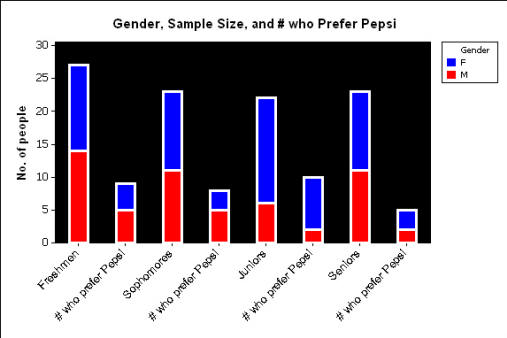
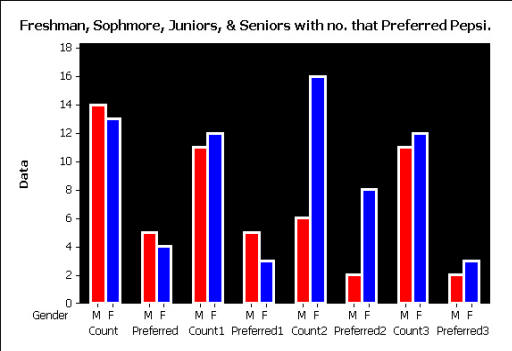
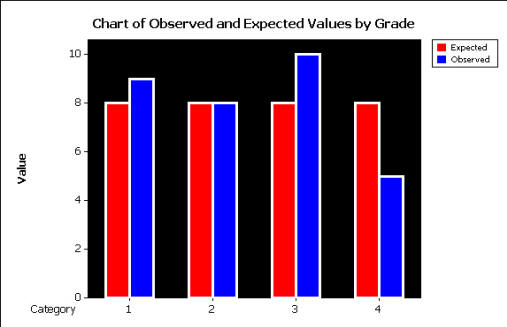
Some simple bar and pie charts are available below because this is categorical data and as a result, there is not too much I can do in the way of graphs. I did all of the graphs in Pepsi Cola colors because I am trying to find out whether or not Pepsi is more well liked than Coke in high school students.
Page navigation
sub page menu