
We will receive a list of all guys and girls attending NOHS from Mrs.
Caso and put it into Minitab.
We are using stratified
sampling technique by splitting the population into guys and girls.
Then we will take a simple random sample of size 80 for both guys
and girls using sample from columns in Minitab.
Our
population of interest is all the students attending
Our Survey
Circle one: MG MD AHMale
Female
What
Our Data
Male Female TotalIndians 9 15 24
Browns 7 6 13
Cavaliers 40 32 72
Monsters 3 3 6
Total 59 56 115
Hypothesis Test
Ho: Gender and Sports Preference have no associationHa: Gender and Sports Preference have an association
α = 0.05 df = 3
Assumptions: We need all expected cell counts to be greater than or equal to 5. Independently and randomly chosen.
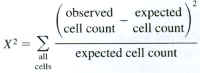 = 2.389177
p-value = .49565
Conclusion: 2 of our expected cell counts were less than 5. Therefore, our chi square test was probably invalid. This could have been contributed to our sample size because of tour response bias.
Minitab Output
Chi-Square contributions are printed below expected counts
1 9 15 24
12.31 11.69
0.891 0.939
6.67 6.33
0.016 0.017
36.94 35.06
0.254 0.267
3.08 2.92
0.002 0.002
2 cells with expected counts less than 5.
Revised Hypothesis Test
Ho: There is no difference in Sports Preference among students at North Olmsted High SchoolHa: There is a difference in Sports Preference among students at North Olmsted High School
α = 0.05 df = 3
Assumptions: We need all expected cell counts to be greater than or equal to 5. Randomly chosen.
= 92.47826087p-value ≈ 0
Conclusion: We rejected the null hypothesis at the .05 level of significance because our p-vaule was less than alpha. Therefore, there is sufficient evidence to suggest that there is a difference in sports preference among students at North Olmsted high School in at least one category.
Revised Minitab Output
Category Observed Proportion Expected to Chi-Sq
1 24 0.25 28.75 0.7848
2 13 0.25 28.75 8.6283
3 72 0.25 28.75 65.0630
4 6 0.25 28.75 18.0022
115 3 92.4783 0.000