The Sample
To obtain our sample size, we had to think about who our study would apply to. The students who are most likely to have taken the
SAT or ACT were juniors and seniors, so we had to limit our sample to them. Next, we got a list of all students in the school,
and then cut it down to 11th and 12th graders. We realized we needed a margin of error in case a
large number of students have not taken the test or do not know their scores. We were hoping for a sample size of 30 so we could
use the Central Limit Theorem, therefore we decided on a sample size of 150. In Minitab, we went to Calc, then Random Data, and
chose Sample from Columns. This gave us a random sample of 150 juniors and
seniors in our school. We sent surveys our surveys to their study halls,
eliminating students who were at post-secondary education all day.Our survey asked them about their test scores, as
well as the number of books they think they read each semester. Here is a copy of the survey we sent out:
Survey
1. On average, how many books do you
read per semester?
List the number of books read _______
2. Did you take the SAT or ACT?
Circle one:
SAT
ACT
BOTH
3. What was your total score?
SAT_________
ACT_________
4. What was your CRITICAL READING
score on the test?
SAT_________
ACT_________
ß =
slope of the regression line relating test scores to books read
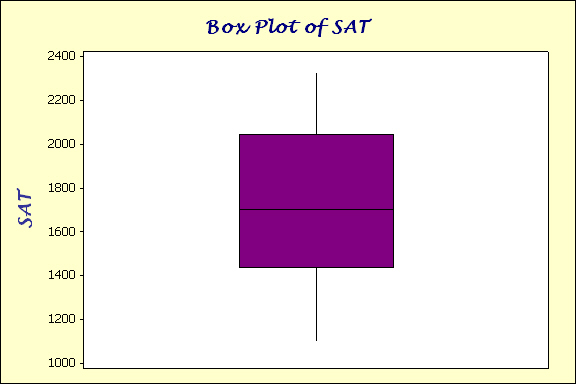
Assumptions: The sample was random. n>30 so the
central limit theorem applies. Assumptions: The sample was random. The box plot was
normal therefore the sample was normal.
The
Descriptive Statistics of Books vs. A.C.T
Variable N N* Mean SE Mean StDev Minimum Q1 Median Q3
Books 44 0 4.955 0.590 3.912 0.000 2.000 4.000 6.000
ACT 44 0 24.000 0.684 4.539 13.000 21.000 24.000 27.000
Books 20.000
ACT 33.000
From the above statistics, we can see that there
seems to be a correlation between the number of books read and the ACT
scores. As the data increases from Quartile 1 of books, that is 2.000,
to Quartile 3 of books, that is 6.000, the data for the ACT scores seems
to increase as well from 21.000 to 27.000. Therefore, we see that there
is a correlation between these two subjects.
The Descriptive Statistics of Books vs. SAT
SAT 13 0 1728 100 361 130486 20.91 1100 1435
Books 13 0 6.615 0.730 2.631 6.923 39.77 2.000 4.500
SAT 1700 2045 2330
Books 7.000 9.000 10.000
From the above statistics, we can see that there seems to
be a correlation between the number of books read and the SAT scores. As
the data increases from Quartile 1 of books, that is 4.500, to Quartile
3 of books, that is 9.000, the data for the SAT scores seems to increase
as well from 1435 to 2045. Therefore, we see that there is a correlation
between these two subjects.
Hypothesis Tests- ACT
![]()
The regression equation is
ACT = 23.6 + 0.112 Books
Constant 23.635 1.053 22.45 0.000
Books 0.1123 0.1725 0.65 0.518
Regression 1 8.63 8.63 0.42 0.518
Residual Error 45 916.00 20.36
Total 46 924.64
We failed to reject the null hypothesis at 0.05 level of
significance since our p-value of 0.518 is greater than alpha.
Therefore, we do not have sufficient evidence to say that there is a
linear relationship between the number of books read vs. ACT scores.
Hypothesis Tests- SAT
ß =
slope of the regression line relating test scores to books read
![]()
SAT = 1211 + 78.1 Books
Constant 1211.0 241.1 5.02 0.000
Books 78.10 34.04 2.29 0.042
Regression 1 506761 506761 5.26 0.042
Residual Error 11 1059070 96279
Total 12 1565831
Conclusion:
We reject the null hypothesis at the 0.05 level of significance since
our p-value of 0.042 is less than alpha. Therefore we have sufficient
evidence to say that there is a linear relationship between the number
of books read vs. SAT scores.