
Our Study
Our sample consisted of 75 randomly chosen girls and 75 randomly chosen guys. We obtained our sample by getting the master list of the students from our teacher, Mrs. Caso. Then we sorted the students by gender and put them into two separate spreadsheets. Then we used the sample from columns feature on Minitab and we randomly chose 75 of each gender resulting in a total sample size of 150 students. Our population of interest in this study was all the students who attended North Olmsted High School. Our sample consisted of an equal number of students from each gender and a variety from each grade.
Survey
1. On projects (any assignments lasting one week or more), when do you start the assignment: (circle ONLY ONE):
1 - Right Away
2 - In a Timely Fashion
3 - The Night Before
4 - The Morning of (before school)
5 - The Period Before
6 - Minutes Before
7 - The Day After it’s Due
2. What is your favorite sport to play? (Circle ONLY ONE):
1 – Football 7 – Track
2 – Basketball 8 – Baseball/ Softball
3 – Tennis 9 – Hockey
4– Volleyball 10 – Swimming/Diving
5 – Soccer 11 – Wrestling
6 – Cross Country 12 - Other
3. Please circle your gender: MALE FEMALE
________________________________________________________________________________________
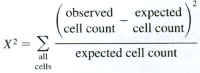
Hypothesis Testing using Chi-Square
Ho: There is no association between favorite sport and procrastination level
Ha: There is an association between favorite sport and
procrastination level
α = .05, df=9
Assumptions: We do have independent random samples and for now we are going to assume we have all expected cell counts of 5 or more.
3.16 4.11 1.53 2.20 11.00
17.22 22.43 8.35 12.00 60.00
10.04 13.09 4.87 7.00 35.00
2.58 3.37 1.25 1.80 9.00
33.00 43.00 16.00 23.00 115.00
Expected count
Likelihood Ratio Chi-Square = 8.415, DF = 9, P-Value = 0.493
p-value = 0.585
|
|