The "R-Word"
 Study
Study
People with disabilities have abilities too and that is what this course is all about - making sure those abilities blossom and shine so that all the dreams you have can come true.
Mary McAleese
Our population of interest was all of
the teachers and students in
1. How often do you use the word “retard” or “retarded”?
Everyday A Few Times a Week Once Every Few Months Never Not Sure
2. When you use “retard” or “retarded” do you use it as a medical term?
Yes No
3. Do you personally know someone with a mental or physical disability?
Yes No
1.) H0: There is no association between whether or not a student has a personal relationship with someone with an intellectual disability and how frequent they use the r-word.
2.) Ha: There is an association.
3.) α = 0.05
4.) Assumptions: The cell count was based on an independent random sample. Also we must assume that all expected cell counts are greater than four. Because of first test using all 5 frequency categories failed to produce expected cell counts of greater than 5, we grouped these frequencies into two categories-Everyday & A Few Times a Week (category A) and Once Every Few Months, Never, & Not Sure (category B). Below is a table of new expected cell counts:
| A | B | Total | |
| No | 9 | 9 | 18 |
| Yes | 34 | 22 | 56 |
| Total | 43 | 31 | 74 |
5.)
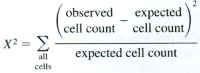
6.)
Pearson Chi-Square = 0.642, DF = 1, P-Value = 0.423
Likelihood Ratio Chi-Square = 0.637, DF = 1, P-Value = 0.425
X2 = 0.642 with 1 df
7.) P-value = 0.423
8.) We fail to reject the null hypothesis at the 0.05 level of significance because the p-value is greater than alpha. Therefore, we have insufficient evidence to say that there is an association between whether or not a student has a personal relationship with someone with an intellectual disability and how frequent they use the r-word.
1.) H0: There is no association between whether or not a student uses the word as a medical term and how frequent they use the r-word.
2.) Ha: There is an association.
3.) α = 0.10
4.) Assumptions: The cell count was based on an independent random sample. Also we must assume that all expected cell counts are greater than four. Because of first test using all 5 frequency categories failed to produce expected cell counts of greater than 5, we grouped these frequencies into two categories-Everyday & A Few Times a Week (category A) and Once Every Few Months, Never, & Not Sure (category B). Below is a table of new expected cell counts:
| A | B | Total | |
| No | 38 | 22 | 60 |
| Yes | 5 | 9 | 14 |
| Total | 43 | 31 | 74 |
5.)
6.)
Pearson Chi-Square = 3.557, DF = 1, P-Value = 0.059
Likelihood Ratio Chi-Square = 3.523, DF = 1, P-Value = 0.061
X2 = 0.3577 with 1 df
7.) P-value = 0.423
8.) We reject the null hypothesis at the 0.05 level of significance because the p-value is greater than alpha. Therefore, we have sufficient evidence to say that there is an association between whether or not a student uses the r-word as a medical term and how frequent they use the r-word.
1.) H0: There is no association between whether the responder is a teacher or a student and how frequent the responder uses the r-word.
2.) Ha: There is an association.
3.) α = 0.05
4.) Assumptions: The cell count was based on an independent random sample. Also we must assume that all expected cell counts are greater than four. Because of first test using all 5 frequency categories failed to produce expected cell counts of greater than 5, we grouped these frequencies into two categories-Everyday & A Few Times a Week (category A) and Once Every Few Months, Never, & Not Sure (category B). However, this too yielded expected cell counts that were less than 5.
| A | B | Total | |
| Student | 43 | 31 | 74 |
| Teacher | 0 | 9 | 9 |
| Total | 43 | 40 | 83 |
5.)
6.)
Pearson Chi-Square = 10.852, DF = 1, P-Value = 0.001
Likelihood Ratio Chi-Square = 14.323, DF = 1, P-Value = 0.000
X2 = 10.852 with 1 df
7.) P-value = 0.001
8.) We reject the null hypothesis at the any reasonable level of significance because the p-value is less than alpha. Therefore, we have sufficient evidence to say that there is an association between whether the responder is a teacher or a student and how frequent the responder uses the r-word.