
Graphical Analysis
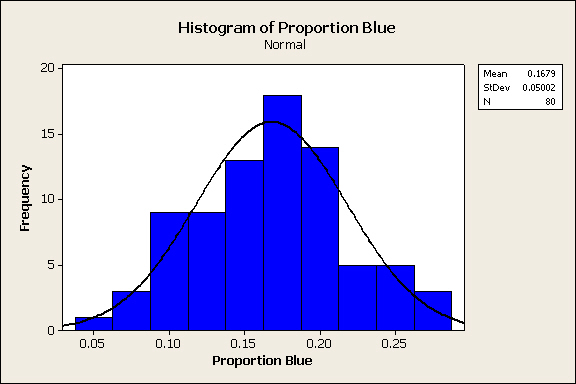
The graph is normally distributed with a mean proportion of 0.1679.
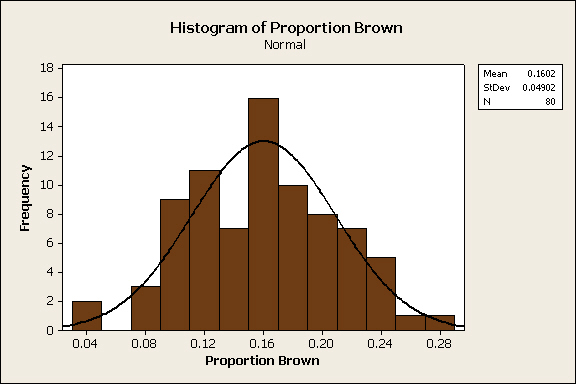
The graph is normally distributed with a mean proportion of 0.1602. Also, the mean proportion is exactly equal to the median proportion.
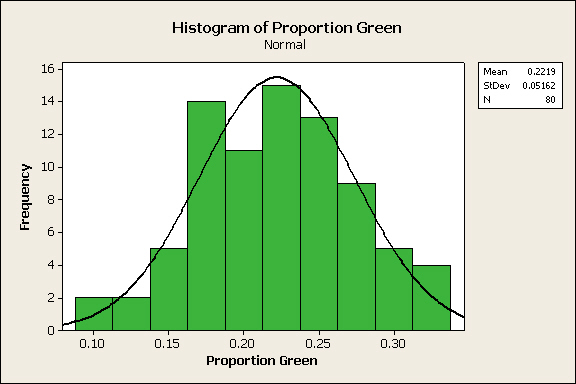
The graph is fairly normally distributed with a mean proportion of 0.2219. Most of the proportions fall in the range of 0.17 to 0.26.
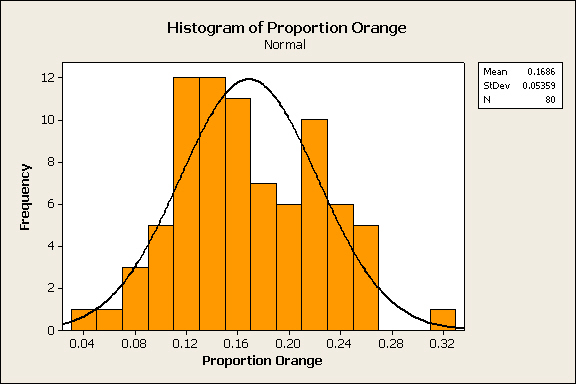
The graph is the least normally distibuted and has the greatest standard deviation of all of the graphs. The mean proportion is 0.1686.
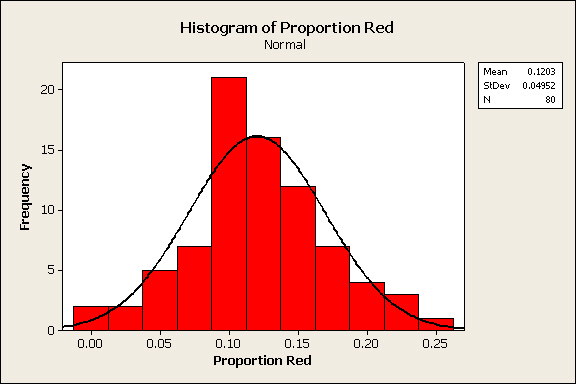
The graph is normally distributed with a mean proportion of 0.1203. The graph shows that proportions close to 0.10 were the most common.
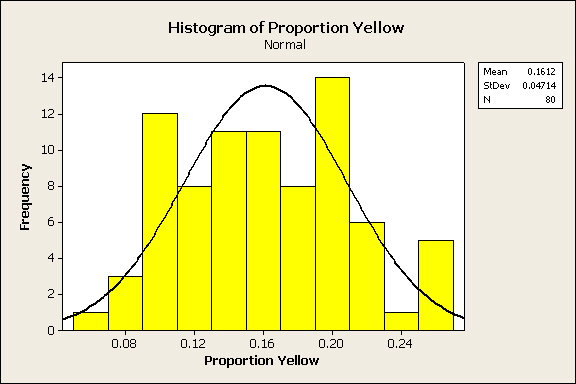
The graph is bimodal with mean proportion of 0.1612.