Is the true proportion of blue M&Ms in a bag greater than the true proportion of orange M&Ms in a bag?
1. π1 = the true proportion of blue M&Ms per bag
π2 = the true proportion of orange M&Ms per bag
2. H0: π1 = π2
3. Ha: π1 > π2
4. α = 0.05
5. Assumptions: Samples must be random and independently selected.
np1 = 4436(744/4436) = 744 > 10 n(1 - p1) = 4436(3692/4436) = 3692 > 10
np2 = 4436(747/4436) = 747 > 10 n(1 - p2) = 4436(3689/4436) = 3689 > 10
Since all assumptions are met, a two proportion z-test is appropriate.
6.
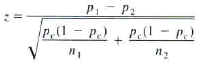
7. z = -0.09
8. Since this is a upper-tailed test, p-value is the area under the curve to the right of
z = -0.09, p-value = 0.543.
---------------------------------------------------------------------------------------------------------------------------------------------------
Is the true proportion of red M&Ms in a bag less than the true proportion of blue M&Ms in a bag?
1. π1 = the true proportion of red M&Ms per bag
π2 = the true proportion of blue M&Ms per bag
2. H0: π1 = π2
3. Ha: π1 < π2
4. α = 0.05
5. Assumptions: Samples must be random and independently selected.
np1 = 4436(534/4436) = 534 > 10 n(1 - p1) = 4436(3902/4436) = 3902 > 10
np2 = 4436(744/4436) = 744 > 10 n(1 - p2) = 4436(3692/4436) = 3692 > 10
Since all assumptions are met, a two proportion z-test is appropriate.
6.
7. z = -6.36
8. Since this is a lower-tailed test, p-value is the area under the curve to the left of
z = -6.36, p-value = 0.000.
--------------------------------------------------------------------------------------------------------------------------------------------------
Is the true proportion of brown M&Ms in a bag different than the true proportion of green M&Ms in a bag?
1. π1 = the true proportion of green M&Ms per bag
π2 = the true proportion of brown M&Ms per bag
2. H0: π1 = π2
3. Ha: π1 ≠ π2
4. α = 0.05
5. Assumptions: Samples must be random and independently selected.
np1 = 4436(984/4436) = 984 > 10 n(1 - p1) = 4436(3452/4436) = 3452 > 10
np2 = 4436(712/4436) = 712 > 10 n(1 - p2) = 4436(3724/4436) = 3724 > 10
Since all assumptions are met, a two proportion z-test is appropriate.
6.
7. z = -7.37
8. Since this is a two-tailed test, p-value is the area under the curve to the left of z = -7.37 and to the right of z = 7.37, p-value = 0.000.
---------------------------------------------------------------------------------------------------------------------------------------------------
Do the proportions reported by the M&M
company differ from the sample proportions per bag?
1. π1-π6 = the true proportion of M&Ms per bag of brown, yellow, orange, red, green, and blue respectively.
2. H0: π1= 0.13, π2 = 0.14, π3 = 0.20, π4 = 0.13, π5 = 0.16, π6 = 0.24
3. Ha: At least one differs.
4. α = 0.05
5. Assumption: Samples are randomly selected and all expected values are > 5.
| Expected Brown |
Expected Yellow |
Expected Orange |
Expected Red |
Expected Green |
Expected Blue |
|
576.68 |
621.04 |
887.20 |
576.68 |
709.76 |
1064.64 |
Since the assumptions are met, a chi-square test is appropriate.
6.

7. X2 = 273.183
8. The p-value = 0.000 with 5 degrees of freedom.