| Car Color Popularity |
North Olmsted Red/Green 2000-2011 |
Significance Test
P 1 = The true proportion of red/green cars in North Olmsted
1. Ho: P1=0.1394 --> 0.1394 is the proportion of red/green cars in the U.S.
2. Ha: P1 ≠ 0.1394
3. α = 0.05
4. Assumptions: n1(p1)=2638 n1(1-p1)=10801.06
The sampling was random and independent.
Our sample size was 13,439 cars as compared to the total of 241,157,054 cars total in the US, so the sample size is less than 10% of the population.
5.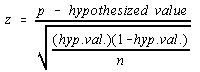 =19.0424
6. P-value=0.000
7.Conclusion: We reject the null hypothesis at any level of significance because our p-value is 0. Thus, there is sufficient evidence to support the claim that the true proportion of red/green cars in North Olmsted is not equal to the proportion of red/green cars in the U.S.