The Study
Sampling
Our sample was obtained through use of
the Minitab program. We imported a list of the names of all of the
students in North Olmsted High School, along with their grade level
and gender. We chose a random sample of 200 students using the
Calc>Random Data>Sample from Columns function. Our population of
interest was the student body of North Olmsted High School. This was
the survey used to obtain data from our sample:
Which political
party do you identify with?
ð
Democratic Party
ð
Republican Party
ð
I do not identify
with either of these parties.
What is your
cumulative GPA as of the end of last semester?
_______________________________
Significance Test
H0: There is no
association between party affiliation and cumulative GPA of North
Olmsted high school students.
Ha: There is an
association between party affiliation and cumulative GPA of North
Olmsted high school students.
Significance level: 0.05
Assumptions: Our sample was random.
All expected cell counts were less than 5.
Observed cell counts:
|
Democrats |
Republicans |
Neither |
|
|
1-<3 |
17 |
7 |
18 |
|
3-<5 |
32 |
17 |
25 |
Expected cell counts:
|
Democrats |
Republicans |
Neither |
|
|
1-<3 |
17.741 |
8.6897 |
15.569 |
|
3-<5 |
31.259 |
15.31 |
27.431 |
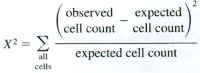
X2
= (17 – 17.741)2 / 17.741 + (7 – 8.6897)2 /
8.6897 + (18 – 15.569)2 / 15.569 + (32 – 31.259)2
/ 31.259 + (17 – 15.31)2 / 15.31 + (25 – 27.431)2
/ 27.431
X2 = 1.1586
p-value: 0.56
df = 2