Study
Sampling Technique
The population of interest for our study consisted of all students at NOHS. After obtaining a list of all students currently enrolled at NOHS from Mrs. Caso, we randomly sampled 50 male students and 50 female students. To do this, we used MINITAB (Calc->Random Data->Sample From Columns) with the aforementioned data. After finding our sample, we looked up the students’ schedules at the North Olmsted Main Office in order to determine when it would be best to send the surveys to the students’. We received valid responses for half of the surveys we sent out, 26 of 50 males returned valid responses and 27 of 50 females returned valid responses.
Sampling Survey
Sample
Survey
After completing the survey, please return this sheet to
your teacher.
Please indicate your gender: M _ F _
How many extracurriculars are you in this year?
Extracurriculars include sports, clubs, etc.
Hypothesis Test: Two-Sample t-test
1.
µ1
= the true mean number of extracurricular activities
girls at North Olmsted High School participate in.
µ2
= the true mean number of extracurricular activities
boys at North Olmsted High School participate in.
2.
Ho: µ1 - µ2
= 0
3.
Ha: µ1 - µ2
≠ 0
4.
α = 0.05
5.

6.
Assumptions:
·
Both samples are independently and randomly chosen
(or treatments are assigned independently and
randomly)
·
The population is normal here are boxplots showing
that both samples appear to be normal.

7.
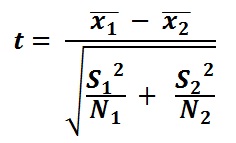
t = -2.63 at 41 df
8.
p = 0.012
Two-Sample T-Test and CI: Male, Female
Two-sample T for Male vs
Female
N
Mean
StDev
SE Mean
Male
26
1.27
1.22
0.24
Female
27
2.52
2.14
0.41
Difference = μ (Male) - μ (Female)
Estimate for difference:
-1.249
95% CI for difference:
(-2.210, -0.289)
T-Test of difference = 0 (vs
≠): T-Value = -2.63
P-Value = 0.012
DF = 41
Copyright 2012. Designed by Flash Templates
Privacy Policy | Terms of Use | XHTML | CSS