.Who usesTechnology more?

.:The Study

Sampling
The sampling size for my project is 80. I went to Great Northern Mall and handed out 40 surveys to random males and 40 surveys to random females. I was walking all around the mall, but did not enter the stores. I stopped in front of many different stores. While I was in front of the stores, I asked people entering and exiting the stores to take my survey. I also asked people that were walking close me in the main part of the mall to take my survey. The population of interest is the North Olmsted Area.
TECHNOLOGY SURVEY
Circle one answer for each question.
1.) Approximately how many hours a week do you spend watching t.v. for your own personal enjoyment?
One hour or less 2-3hours 4-5hours 6 or more hours
---------------------------------------------------------------------
2.) Approximately how many hours do you spend playing video games a week?
One hour or less 2-3hours 4-5hours 6 or more hours
---------------------------------------------------------------------
3.)Approximately how many hours a week do you spend on electronics in total (besides t.v. and video games) for your own personal enjoyment (i.e. Computer, online games, cell phones, electronic instruments, radio, camera, ipod, etc.)?
One hour or less 2-3hours 4-5hours 6 or more hours
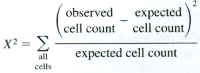
Significance Test
A relevant Chi-Squared Test for Homogeneity was used to figure if the amount of time that males and females spend on technology differs.
Null Hypothesis: The amount of time that males and females spend on technology is the same.
Alternative Hypothesis: The amount of time that males and females spend on technology differs.
Significance Level: α=.05
Test Statistic:
Assumptions: The observed counts are from a random sample. The sample size is large. We need the expected cell counts to be 5 or more.
Calculation:
Results for: Q1.MTW
Chi-Square Test: One hour or less, 2-3hours, 4-5hours, 6 or more hours
Expected counts are printed below observed counts
One hour 2-3hours 4-5hours 6 or mor Total
1 2 11 18 6 37
3.50 9.50 16.00 8.00
2 5 8 14 10 37
3.50 9.50 16.00 8.00
Total 7 19 32 16 74
Chi-Sq = 0.643 + 0.237 + 0.250 + 0.500 +
0.643 + 0.237 + 0.250 + 0.500 = 3.259
DF = 3, P-Value = 0.353
2 cells with expected counts less than 5.0
Results for: Q2.MTW
Chi-Square Test: One hour or less, 2-3hours, 4-5hours, 6 or more hours
Expected counts are printed below observed counts
One hour 2-3hours 4-5hours 6 or mor Total
1 32 2 2 1 37
19.50 2.50 5.00 10.00
2 7 3 8 19 37
19.50 2.50 5.00 10.00
Total 39 5 10 20 74
Chi-Sq = 8.013 + 0.100 + 1.800 + 8.100 +
8.013 + 0.100 + 1.800 + 8.100 = 36.026
DF = 3, P-Value = 0.000
2 cells with expected counts less than 5.0
Results for: Q3.MTW
Chi-Square Test: One hour or less, 2-3hours, 4-5hours, 6 or more hours
Expected counts are printed below observed counts
One hour 2-3hours 4-5hours 6 or mor Total
1 10 15 3 9 37
9.00 15.50 4.50 8.00
2 8 16 6 7 37
9.00 15.50 4.50 8.00
Total 18 31 9 16 74
Chi-Sq = 0.111 + 0.016 + 0.500 + 0.125 +
0.111 + 0.016 + 0.500 + 0.125 = 1.504
DF = 3, P-Value = 0.681
2 cells with expected counts less than 5.0
P-value: There were 3 degrees of freedom for this test. The first X² test, Question 1, had a P-value of 0.353. The second X² test, Question 2, had a P-value of 0. The third X² test had a P-value of 0.681.
![]()
![]()