Graphs
After collecting the data, we entered the values into MiniTab and created the following graphs.
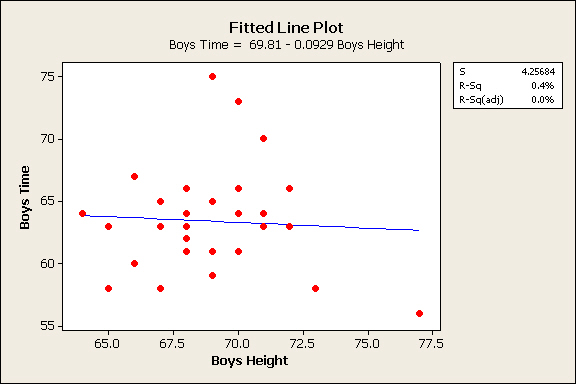
The boys time vs height graph revealed that there was nearly no useful relationship between height and times for a 400 meter sprint for boys. With an r value of 0.4% and an r² value of 0.0%, we expected that there would be no useful linear relationship.
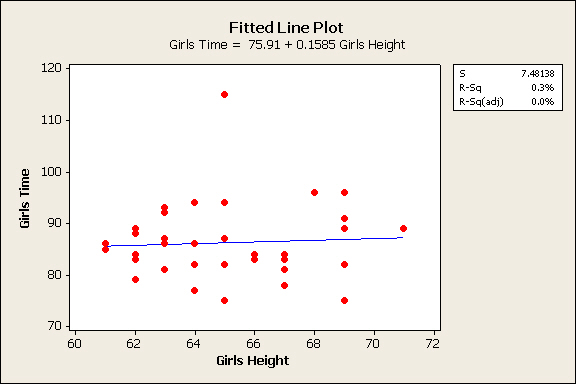
The girls time vs height graph also displayed that there was nearly no useful relationship between height and times for a 400 meter sprint for girls. With an r value of 0.3% and an r² value of 0.0%, we expected that there would be no useful linear relationship.
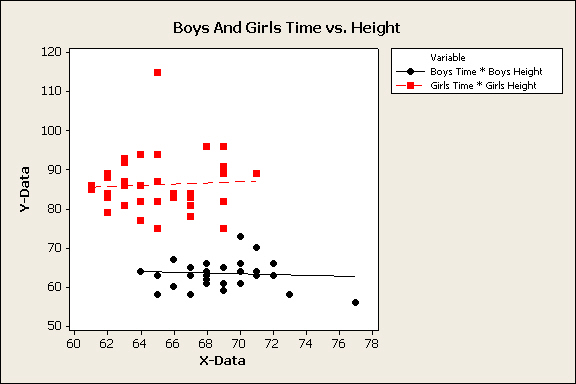
By creating a plot with both the data sets back to back, we were able to compare the correlations for each gender. Obviously, neither graph appears to have any remotely useful linear relationship, so we predicted that we would not be rejecting the null hypothesis for either gender.
What else?
Check out the other projects
To view the other AP Statistics projects, click the link below.
Go to other AP Statistics Projects
Follow the latest track news
Follow the latest news in high school track and other sports at cleveland.com. To proceed, click on the link below.