The Study
We obtained our sample through a random name generator. Our instructor gave us a list of every shouldn't who attends NOHS, we won't to Minitab, and used its random name generator to obtain our sample. Our population of interest was every student who attends NOHS. From that population we obtain 150 students, of which we used 115, consisting of grades 9th through 12th, also girls and boys. We looked at each students schedule to find the right time to give them the survey. We put sticky notes on each survey writing the name of the student, and the teacher, period, and room number to specify when the student will be taking the survey. We gave all of our samples wit ht eh sticky notes to the front office, which they will distribute them to the corresponding teachers, which will then be given to the corresponding students.
AP Stats Survey
Circle the sport that you think is more boring to watch on TV. Write your favorite sport in the line provided.
Golf NASCAR __________________
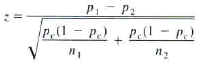
Two-Proportion Z-Test
π1=The true proportion of students who believe golf is more boring than NASCAR.
π2= The true proportion of students who believe NASCAR is more boring than golf.
Ho: π1= π2
Ha: π1 > π2
α = .05
We randomly chose the sample and since our sample size is greater than 30 (115), the Central Limit Theorem holds true.
Two-Proportion Z-Test:
Test and CI for Two Proportions
Sample X N Sample p
1 47 115 0.408696
2 68 115 0.591304
Difference = p (1) - p (2)
Estimate for difference: -0.182609
95% upper bound for difference: -0.0759739
Test for difference = 0 (vs < 0):
Z = -2.82
P-Value = 0.002