Sampling Technique
| Our sampling technique was dictated by the initial intent of our study, and was later modified to our new question. Since we began by only comparing two populations (by publisher), we decided to utilize a stratified sample, with strata determined by genre of literature. We decided that this would give us information about each individual genre that would be overlooked in a more general simple random sample; in addition, since the library already organized books by genre, a stratified random sample would actually be easier to collect than would a simple random sample. We collected our stratified random sample by making use of the library’s own catalog of books by genre. The library indexes books by genre, with each book having a unique number in the ordered list. The list is ordered by author's last name. We used the library catalog to determine how many books there were in each genre. Then, using MINITAB, we randomly selected 100 of the numbers from each genre in a simple random sample within each stratum, as per the rules of stratified random sampling. |
 |
As we collected the data, we were forced to reevaluate our study; the strata became instead five populations. Thus, the populations for our study were the population of Adult Classic books at Westlake Porter Public Library, the population of Fantasy books at the library, the population of Historical Fiction books at the library, the population of Mystery books at the library, the population of Romance books at the library, and the population of Science Fiction books at the library. Within the data we collected, we directly controlled publisher so that we only considered those books published on the eastern coast of the United States. This resulted in samples from each population of slightly less than 100. The sampling sizes were as follows: 86 for Fantasy, 90 for Historical Fiction, 86 for Science Fiction, 95 for Mystery, and 86 for Romance. The resulting sample, then, was a set of 5 simple random samples from 5 discrete populations that were directly controlled for publisher location.
Test the First: Chi-Square Analysis
The first test we performed was a chi-square analysis for homogeneity of populations. We analyzed the data categorically, grouping the page number data into five bins for each genre: less than 100, 100-200, 200-300, 300-400, and greater than 400. These are the same bins that were used to construct the density histograms on the 'Graphs' page. We then analyzed the null hypothesis (Ho) that all the populations were homogeneous vs. the alternative hypothesis (Ha) that the populations were not homogeneous. The level of significance used was 0.05. A primary assumption of the chi-square test for homogeneity of populations is that the expected cell counts for each cell must be 5 or greater, and the sample used must be random. By virtue of our sampling technique, we know that the second assumption is met. The formula for the computation of the chi-square test statistic is the sum of the quantity (expected cell count-observed cell count)^2/(expected cell count) =

Chi-Square contributions are printed below expected counts
1 0 18 3 3 0 24
4.66 4.88 4.66 5.15 4.66
4.659 35.326 0.591 0.895 4.659
13.78 14.42 13.78 15.23 13.78
6.944 12.777 11.856 5.590 24.076
32.23 33.72 32.23 35.60 32.23
11.470 0.088 2.641 8.507 5.064
23.30 24.38 23.30 25.73 23.30
6.928 6.286 3.252 1.526 10.043
12.04 12.60 12.04 13.30 12.04
36.514 12.596 18.604 11.371 10.119
4 cells with expected counts less than 5.
Here, we see that the first assumption for the chi-square test is NOT met. There are 4 cells that have expected cell counts that are less than 5, and therefore the results of this test cannot be considered statistically conclusive. However, the results of the test were very interesting in that they were extremely large in magnitude, even though the assumptions were not met. The value the chi-square test statistic was 252.382 with 16 degrees of freedom, and the p-value was 0.000. Even though the assumptions were not met, this test still provides some amount of intuitive evidence supporting the idea that the population proportions are not truly homogeneous for each genre. However, a definitive statement of this conclusion will require further analysis. And so, the legend continues...
Test the Second: 95% Confidence Intervals
We decided that in light of the statistical failure of our first
test, the best way to compare the relative page lengths of each of
the five genres would be to construct 95% confidence intervals for
the true mean page length of each of the 5 genres. We used a
t-interval because the population standard deviations were unknown
for all five populations. The first major assumption concerning the
construction of a 95% t-interval is that the sample used must be
random. Once again, our sampling technique meets this assumption. In
addition, the population standard deviations should be unknown (also
true). Finally, the population distributions must be assumed to be
normal, or all sample sizes must be greater than 30. Since all of
our sample sizes are, in fact, greater than 30, the Central Limit
Theorem states that the sampling distributions of the population
means should be normal, and therefore the t-intervals can be
properly constructed. The formula for the construction of a
t-interval with 95% confidence is given by ((sample mean) -
(t-critical value)(sample standard deviation/radical(n)), (sample
mean) + (t-critical value)(sample standard deviation/radical(n))).
In symbols, this formula becomes
x ± (t
critical value)![]()
One-Sample T: Fantasy
Fantasy 86 381.1 110.0 11.9 (357.5, 404.6)
One-Sample T: Historical
Historical 90 193.88 93.02 9.80 (174.40, 213.36)
One-Sample T: Science
Science 86 377.2 170.1 18.3 (340.8, 413.7)
One-Sample T: Mystery
Mystery 95 272.78 74.88 7.68 (257.52, 288.03)
One-Sample T: Romance
Romance 86 232.93 74.05 7.99 (217.05, 248.81)
The construction of the 95% t-intervals revealed an interesting and rather surprising fact. With the exception of Fantasy and Science Fiction, none of the 95% confidence intervals overlapped. That is, when we generated with 95% confidence intervals within which each population mean should be, it was very clear that the means fell into a definite order because, for the most part, the intervals did not overlap. Historical fiction was the smallest genre, with the population mean falling between 174.40 and 213.30 pages with 95% confidence. The next largest genre was Romance, with the population mean falling between 217.05 and 248.81 pages with 95% confidence. Mystery was the next largest; we can say with 95% confidence that the true mean page length of mystery books was between 257.52 and 288.03. Finally, Fantasy and Science Fiction had intervals that overlapped quite heavily, meaning that no true conclusion could be drawn about their relative sizes. However, both genres were definitely larger than all of the others; with 95% confidence, Fantasy's true mean page length falls between 357.5 and 404.6 pages, while Science Fiction's true mean page length falls with 95% confidence between 340.8 and 413.7 pages. Thus, our confidence interval analysis allows us to come to he conclusion that Historical is less than Romance is less than Mystery which is less than Fantasy and Science Fiction in terms of page length. However, we were as yet unsatisfied, as we wished to try and draw a clear distinction between Fantasy and Science Fiction. Thus, we moved onward, to a new test, and a new day...
Test the Third: Two-Sample T-Test between Science Fiction and Fantasy
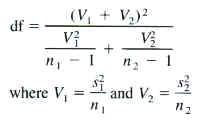
Our confidence interval analysis was largely sufficient to order the genres in a distinct hierarchy. For the most part, none of the intervals overlapped each other, and therefore the means took on a definite order of size. Howe4ver, this was not the case for Science Fiction and Fantasy, whose confidence intervals largely overlapped despite both being much larger than any of the other genres. To try and draw a distinction between them, we performed a two sample t-test comparing the true population means of Science Fiction and Fantasy. We took as our null hypothesis that the mean of Science Fiction = the mean of Fantasy, and used mean Fantasy is greater than mean Science Fiction as our alternative hypothesis. That is, Ho: meansf=meanf, and Ha: meanf>meansf. Once again, we must meet all of the assumptions of a two-sample t-test: the samples used are random, both sample sizes are greater than 30, and both population standard deviations are unknown. The level of significance that will be used is 0.05. The formula for the test statistic of a two-sample t interval is
(x1-
x2) ±
(t crit. value) where
where
N Mean StDev Mean
Fantasy 86 381 110 12
Science 86 377 170 18
Estimate for difference: 3.8
95% lower bound for difference: -32.3
T-Test of difference = 0 (vs >): T-Value = 0.18 P-Value = 0.431 DF = 145
We fail to reject the null hypothesis at the 0.05 level of significance because our p-value, 0.431, is much larger than the chosen level of significance of 0.05. We do not have enough evidence to suggest that the true population mean page length of the Fantasy genre is larger than that of the Science Fiction genre. Thus, we do not have enough statistical proof to suggest that Fantasy should be higher than Science Fiction in our hierarchy of page length. Our final order of page length, then, from increasing to decreasing, is as follows: Science Fiction/Fantasy (tied), followed by Mystery, followed by Romance, followed by Historical Fiction.