The Actual Study
I obtained the samples from the master list of all the
students. I took the list, and through Minitab,
separated the list into four lists of students from each
grade. From those lists, I took a stratified random
sample of 30 students from each grade. I used Minitab
to get a list of 30 students from each grade. I
obtained the list by taking a sample from the columns. The
sample that I chose was 30 students from each grade. I
wasn’t really monitoring the amount of males and amount of
females that the study had, but it was pretty even.
There were 62 total males and 58 total females. There
were 60 total underclassmen (30 freshmen & 30 sophomores),
and there were 60 total upperclassmen (30 juniors and 30
seniors). There were 18 males and 12 females for the
freshmen, 15 males and 15 females for sophomores, 7 males
and 23 females for juniors, and 18 males and 12 females for
seniors. I am going by grade and not by grade and
gender due to the skewed results. The periods the
students were in was somewhat normally distributed since 60%
of the students (72/120) were in 4/5, 6/7, or 8/9. 24
out of 120 students were in each one of those periods.
45 out of the other 48 students were in 1, 2, 3, 10, or 11
and three (all senior males) were disqualified because they
went to full-time Polaris. There are a total of 117
students in the sample pool. Of these 117 students, 95
responded. 32 students preferred Pepsi, and 63
students preferred Coke. A copy of the survey is below.
Gender: Male Female
Grade: 9 10 11 12
Which do you prefer? Coke Pepsi
Gender: Male Female
Grade: 9 10 11 12
Which do you prefer?
Pepsi Coke
I
alternated Coke and Pepsi to prevent selection bias.
Click here for Graphs
Click Here for Raw Data
I ran several significance tests from the data. The first was a
two proportion z-test to see if the proportion of females that prefer
Pepsi was different than the proportion of males that preferred Pepsi.
I ran the test and got a p-value (p1 - p2)of .949.
The second test was a chi-squared test of the observed and expected
values of the proportions of people in each grade that preferred Pepsi
were all equal. The test results for that chi-square test came out
with a p-value of 0.626. The third test was a 1-proportion z-test
to see if the sample proportion of the people that prefer Pepsi is equal
or not equal to the proportion of people that prefer Coke. I got a
p-value of .004, so I can reject the null hypothesis and say that the
proportion of people that prefer Coke is indeed greater than the amount
of people that prefer Pepsi.
µ1: The true proportion of people that
prefer drinking Pepsi
µ2: The true proportion of people
that prefer drinking Coke
H0: µ1
- µ2 = 0
Ha: µ1
- µ2 ≠ 0
α = .05
Assumptions: n = 30, so the sample is so normal
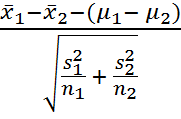
t =

Conclusion: We fail to reject
the null hypothesis at the .05 level because our p-value > α. Therefore,
there is enough significant evidence to prove that the true mean proportion of
females that prefer Pepsi is equal to the amount of males that prefer Pepsi.
µ1: The observed proportion of people that
prefer Pepsi Cola.
µ2: The expected proportion of
people that prefer Coca-Cola.
H0:
µ1 = µ2
Ha:
µ1 ≠ µ2
α = .05
x˛ = (observed - expected)˛ / expected
Assumptions: n = 30, the sample is random.
Category: Observed: Proportion:
Expected: to Chi-Sq
Freshmen 9 0.25
8
0.125
Sophomores 8 0.25 8
0.000
Juniors
10 0.25 8
0.500
Seniors 5 0.25 8
1.125
Conclusion: We fail to reject
the null hypothesis at the .05 level because our p-value > α. Therefore,
there is enough significant evidence to prove that the distribution of those who
prefer Pepsi is any different by grade.
µ1: The true proportion of people that
prefer drinking Pepsi
µ2: The true proportion of people
that prefer drinking Coke
H0: µ1
= µ2
Ha: µ1
≠
µ2
α = .05
Assumptions: n = 30, so the sample is so normal
t =
Conclusion: We reject
the null hypothesis at the .05 level because our p-value < α. Therefore,
there is enough significant evidence to prove that the true mean proportion of
people that prefer Pepsi is not the same as people that prefer Coke.
