
Study
Attaining our sample
The population of interest in this case was the students of North Olmsted High School. We determined that the best sample size for this would be 100 students. Originally, we intended to have 50 males and 50 females, but it would have taken too long and not really affect the results when using the Minitab output to generate the sample. A list of all the students at the high school, stored in an Excel file, was imported to Minitab under 'Surname' and 'First Name' columns. Using Minitab's random generator, 100 students were randomly selected and placed in column C1 and C2. The list was alphabetized by first and last name. After obtaining this sample, surveys were sent to the students based on when their study halls were scheduled.
The following is an example of what was asked in our survey.
1. Gender: Male Female
2. Which ice cream flavor do you prefer of the following types? Chocolate Vanilla
R e s u l t s
Chi-Square Test:
Chocolate, Vanilla
Ho: There is no association between ice cream flavor preference and flavor.
Ha: There is an association between ice cream flavor preference and flavor.
Level of significance = 0.05
Assumptions: expected cell counts must be five or greater; the sample used must be random and independently selected.

The formula for the computation of the chi-square test statistic is the sum of the quantity (expected cell count-observed cell count)^2/(expected cell count).
Expected counts are printed below observed counts
Chi-Square contributions are printed below expected counts
Chocolate Vanilla
Total
1
13
22
35
15.84
19.16
0.510
0.422
2
30
30
60
27.16
32.84
0.297
0.246
Total
43
52
95
Chi-Sq
= 1.475, DF = 1, P-Value = 0.225
Conclusion: We failed to reject the null hypothesis at 0.05 level of significance because our p-value of 0.225 was greater than alpha. Therefore, we do not have sufficient evidence to suggest that is an association between favorite ice cream flavor and gender.
Test and CI for Two
Proportions
Sample
X N
Sample p
1
13 35
0.371429
2
30 60
0.500000
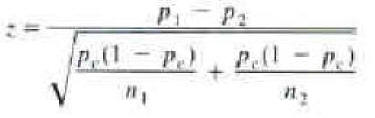
Difference = p (1) - p (2Estimate for difference:
-0.128571
95%
upper bound for difference:
0.0426611
Test
for difference = 0 (vs < 0):
Z = -1.24 P-Value = 0.108
Fisher's exact test: P-Value = 0.158
Chart
of Chocolate, Vanilla
Conclusion: We failed to reject the null hypothesis at 0.05 level of significance since our p-value of 0.108 was greater than alpha. Therefore, we do not have sufficient evidence to suggest that π1- π2 < 0.