Pictures and Quotes

Dance first.
Think later. It's the natural order. ~Samuel Beckett
The Study
In order to create our sample, we obtained the list
of students who attended the 2009 Winter Formal dance at
Survey
Please answer the following questions as honestly and accurately as possible. The results will be used in a project for my statistics class. The results will be anonymous.
1. What is your gender? MALE FEMALE
3. What grade are you in? 9 10 11 12
2. Did you attend the 2009 Winter Formal Dance? YES NO
3. If you did attend the 2009 Winter Formal, did you have a date? YES NO
4. If you answered no to the previous question, approximately how many people did you dance with? (Please be as accurate as possible!) _______________
Descriptive Statistics: Partners for Girls
Variable N N* Mean SE Mean StDev Minimum Q1 Median
Number of Partners for G 74 0 5.797 0.718 6.173 1.000 1.000 5.000
Variable Q3 Maximum
Number of Partners for G 8.250 40.000
Descriptive Statistics: Partners for Boys
Variable N N* Mean SE Mean StDev Minimum Q1 Median
Number of Partners for B 56 0 4.250 0.645 4.829 1.000 1.000 1.000
Variable Q3 Maximum
Number of Partners for B 7.500 20.000
Based upon the Descriptive statistics gathered from Minitab, it appears that the average number of dance partners for females exceeds that of males by 1.547. The standard deviation for the number of dance partners for females also exceeds that of males, but by 1.344. This shows that the female sample has a higher average for the number of dance partners. Also, there is more variability within the female sample.
The Significance Test
We are going to use a two-sample t-test since we want to compare two means, but the population standard deviation is unknown.
µ1 = the true mean number of dance partners for girls who attended the 2009 Winter Formal.
µ2 = the true mean number of dance partners for boys who attended the 2009 Winter Formal.
Ho: µ1 = µ2 (the average number of dance partners for females is equal to that of male)
Ha: µ1 < µ2 (the average number of dance partners for females is less than that of males)
α = 0.05
Assumptions:
- Both samples are independently selected random samples
- Both populations are normally distributed since both n1 and n2 are greater than 30
à Since the population standard deviation is unknown, we must use the t-test instead of the z-test!
n1= 74
n2 = 56
![]() 1 = 5.797
1 = 5.797
![]() 2 = 4.250
2 = 4.250
s1 = 6.173
s2 = 4.829
t – formula:
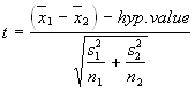
t value = 1.602992616
p- value = .1114041725
degrees of freedom = 127.8417508
Conclusion:
Since our p value is greater than alpha, we failed to reject the null hypothesis at a significance level of .05. Therefore, there is insufficient evidence to say that the true mean number of dance partners for males who attended the 2009 Winter Formal is greater than the true mean number of dance partners for females who attended the 2009 Winter Formal.