


Sampling
We obtained the samples by sitting at the North Olmsted Giant Eagle and counting shoppers who passed through the self-checkout lines per ten minute time interval. We timed each ten minute interval with a stop watch and those who were in the line at the end of an interval, were not counted towards the next interval. Our sample size was every shopper that went through the self-checkout lines per ten minute interval at the North Olmsted Giant Eagle. Our population of interest was all shoppers who went through the self-checkout lines at the North Olmsted Giant Eagle.
1 514 769 0.668401
2 255 769 0.331599
Estimate for difference: 0.336801
95% lower bound for difference: 0.297309
Test for difference = 0 (vs > 0): Z = 14.03 P-Value = 0.000
π1 =The true proportion of females who go through the self-checkout
line at ten minute intervals.
π2 =The true proportion of males who go through the self-checkout
line at ten minute intervals.
Ho: π1 = π2
Ha: π1 > π2
α = 0.05
Assumptions: Independent and random samples. π1 π2
np > 10 np > 10
514(.6684) = 343.5576 > 10 255(.3316) = 84.5580 > 10
n(1-p) > 10 n(1-p) > 10
514(.3316) = 170.4424 > 10 255(.6684) = 170.4420 > 10
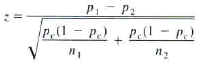 Z = 14.03
p-value = 0