Sampling
For our study we used a sample of students from the population of
students from North Olmsted High School. Using the program of Minitab we
randomly generated a list of 200 students from the population of
Anonymous Survey
What is your favorite band or musical artist?
______________________________
What is your cumulative GPA?
______________________________
Significance Test
For our study, we used a chi-square test for indepence. We chose this test because our objective was to determine if there was an association between two categorical values; music taste and gpa. Even though GPA is a numerical value, we sorted into categories of 2, 3, and 4. The categories are as follows:
0-2.999 = 2
3.000-3.999 = 3
4.000-5.000 = 4
Null Hypothesis: H0 - Taste in music and GPA are independent
Alternative Hypothesis: Ha - Taste in music and GPA are not independent.
Significance level: α = 0.05
Test Statistic: 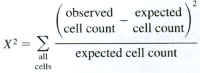
Assumptions: 1. The observed counts are from a random sample
2. The sample size was NOT sufficiently large. Out of our 21 cells, 8 of the expected cell counts were less than 5. This was after we already combined categories to increase the cell counts and we feel that making any more combinations would make any findings inaccurate.
Rows: Genre Columns: GPA Categories
2
3
4
All
Alternative Rock
7
10
5
22
8.090 10.219
3.690
22.000
Country
6
7
4
17
6.252 7.897
2.852
17.000
Pop
8
22
2
32
11.768 14.865
5.368
32.000
Punk Indie
3
4
4
11
4.045
5.110
1.845
11.000
Rap
23
18
7
48
17.652 22.297
8.052
48.000
Rock
7
8
1
16
5.884 7.432
2.684
16.000
Slow Music
3
3
3
9
3.310
4.181 1.510
9.000
All
57
72
26
155
57.000 72.000
26.000
155.000
Pearson Chi-Square = 16.694, DF = 12, P-Value = 0.161
Likelihood Ratio Chi-Square = 16.352, DF = 12, P-Value = 0.176
Conclusion: We fail to reject the null hypothesis at the 0.05 level of significance sicne the P-Value is greater than alpha. Therefore, we have insufficient evidence to say that there is an association between taste in music and GPA.