Sampling
The population of interest for my study was the
entire student population at North Olmsted High School.
The sample was obtained by receiving a list of all 1,384
students at North
Olmsted High School.
After obtaining this list, mini-tab was used to divide the list
based on gender into two separate lists: one for males and one for
females. After the list was divided, mini-tab’s
random data tool and sample from columns tool was used to select 40
random members from each of the female school population and male
school population. Then, the data sort feature was
used to put the two new lists in alphabetical order by last name.
After I had the two lists of students to be included in the
sample, I went to the main office and looked up each student’s
schedule, males first and then females. Each
student’s full period study hall, lunch study hall, or English class
was written down on a post-it note as the destination for the survey
to be sent to depending on the student’s schedule.
English class was used since it is required for all four grade levels.
After recording the teacher, period, and room number the
surveys were to be sent to along with the students’ names on post-it
notes, the post-it notes were put in alphabetical order by last name
of each student’s teacher that the survey was to be sent to.
Finally, the surveys were rubber-banded together and turned
over to Ms. Caso to be distributed.
JB
2012 Statistics Survey
1. Are you a male or a female? (Please place a
check on the appropriate line)
Male_________
Female__________
2. On average, how many hours of sleep do you get
each night? ___________
3. How tall are you? __________ft.
_________inches
Regression Analysis: Height(ft.inchs) versus Hours of Sleep
The regression equation is
Height(ft.inchs) = 5.52 - 0.0120 Hours of Sleep
Predictor Coef SE Coef T P
Constant 5.5210 0.2475 22.31 0.000
Hours of Sleep -0.01202 0.03514 -0.34 0.733
S = 0.423845 R-Sq = 0.2% R-Sq(adj) = 0.0%
Analysis of Variance
Source DF SS MS F P
Regression 1 0.0210 0.0210 0.12 0.733
Residual Error 68 12.2158 0.1796
Total 69 12.2369
Unusual Observations
Hours
of
Obs Sleep Height(ft.inchs) Fit SE Fit Residual St Resid
14 3.0 5.8000 5.4850 0.1459 0.3150 0.79 X
19 7.0 6.3000 5.4369 0.0508 0.8631 2.05R
29 6.5 6.3000 5.4429 0.0525 0.8571 2.04R
37 7.0 4.1000 5.4369 0.0508 -1.3369 -3.18R
59 6.0 4.1100 5.4489 0.0596 -1.3389 -3.19R
R denotes an observation with a large standardized residual.
X denotes an observation whose X value gives it large leverage.
Significance
TestWhy a linear regression
t-test?
The
purpose of the study was to see if there was a useful linear
relationship between two variables, hours of sleep and student
height. Seeing this, there is no other test that could have
been used to draw a useful conclusion from the data. Two
means or proportions were not being compared and while it seems
similar, the data was not appropriate for a goodness of fit test
or test of independence. There are no expected values for a
goodness of fit and the purpose was not to see if the variables
were independent, but to see if there was a useful linear
relationship between them, which is very different.
Nine Step Hypothesis Test
B = the true average change in height associated
with a 1 unit increase in hours of sleep.
H0=B=0
Ha=B/=0
alpha=0.05
Test Statistic=t=b/Sb
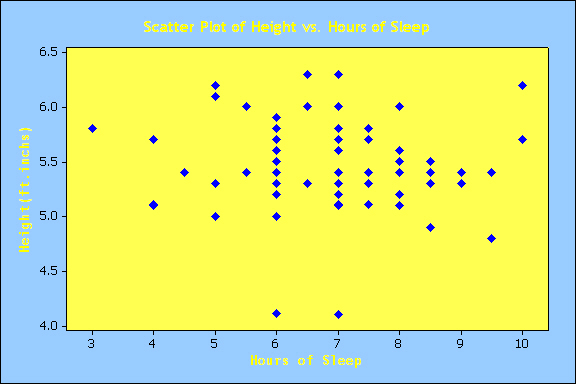
 Assumptions: The scatter plot shows that the variability of points
does not appear to be changing with x(distribution of e at any
point has mean value of o). The distribution of e at
any point appears to have the mean value of 0. As long as the
distribution of e at any particular x value is normal, and the
deviations are independent, the assumptions of the test are met.
Calculate: t=b/Sb=-0.34
P-value:P= 0.733


