Sampling
In order to be able to perform an adequate and well constructed
test, the study must be conducted on a sample that fits correctly
and adequately. Our test consists on taking the gender of person and
asking him how many times, if any, he/she have been pulled over. Our
sample must be chosen very carefully, due to the fact that if there
is one misleading thing about the response we receive in return, the
whole test may be ruined. For this test, we chose to ask 100
upperclassmen (11 & 12 grade) males and 100 upperclassmen (11 & 12
grade) females. With this sample size, we hope to receive enough
feedback to be able to make a reliable test that the public can turn
to for answers.
Our sample was obtained from a list of names, our instructor had
available for us. We tried to make the sampling as unbiased as we
could. It came down to only choosing upperclassmen, since it is more
likely that they have a license and there is a bigger possibility
that he/she has been pulled over for whatever reason. We were able
to use MINITAB to randomize 100 males and 100 females, that way our
test was actually credible and not biased. Once our sample was
randomized and selected, we continued on by sending surveys to the
different classrooms, hoping we can get good feedback for our test.
SURVEY
STATS PROJECT SURVEY
Please answer the following survey to the best of your ability. The questions being asked will not be displayed to the public and are confidential to the viewer (me). Please answer them with honesty for your silly answer may ruin the test being conducted. Thank you for taking time from your day to answer this survey.CIRCLE THE ANSWER THAT BEST APPLIES TO YOU
- Do you have a driver’s license or your temps? YES NO (If no, please stop here)
- How long have you had your license for? _______________
- Have you ever been pulled over for violating any transit laws (speeding, running through a stop sign, running through a light, etc.) YES NO
- Have you ever texted and driven at the same time? YES NO
- Do you own a car of your own? YES NO
- CIRCLE YOUR GENDER FEMALE MALE
THE TEST
H0- There is no assocation between the number of times someone gets pulled over and gender
Ha- There is an association
α: .05
Assumptions: The sample was randomly selected from the population and it is independent from another. The sample size, n, must be large enough so that the expected count in each cell is greater than or equal to 5. In this case, both assujmptions were met.
No Yes Total
Female 60 14 74
Males 57 13 70
Total 117 27 144
 117.00
2
117.00
2
Pearson Chi-Squared = 0.003 DF = 1 P-Value = 0.957
Likelihood Ratio Chi-Square = 0.003, DF = 1, P-Value = 0.957
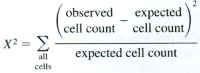
χ² = 0.003 with 1 DF
P-Value = .957
We fail to reject the null hypothesis at any level of significance because our P-Value is greater than any possible alpha. Therefore we have insufficient evidence to say that there is a relationship between the gender of the driver and the amount of times he or she gets pulled over.