


The Study - Our Sampling Method:
We used a survey to obtain a sample of 123 students from North Olmsted High School of both genders. The population of interest was the entire population of North Olmsted High School. Of 150 sent out surveys, we received 123 which we went through individually to obtain the total number of boys and girls in the sample with iPhones, Androids, or neither. After tabulating all the information, we were able to run a 2-proportion z test to determine if the proportion of iPhones at NOHS was greater than the proportion of Androids at NOHS. We also ran a chi-square test to determine if there was an association between gender and phone type.
Hypothesis Tests:
2-Proportion Z Test
Is the true proportion of iPhone users at North Olmsted High School greater than the true proportion of Android users at North Olmsted High School?
1. p1 = the true proportion of iPhone users at North Olmsted High School
p2 = the true proportion of Android users at North Olmsted High School
2. Ho: p1 = p2
3. Ha: p1 > p2
4. α = 0.05
5. Assumptions: The sample must be independently selected and random.
np1 = (123)(.3821) = 47 > 10 n(1-p1) = (123)(1 - 0.3821) = 76 > 10
np2 = (123)(.2764) = 34 > 10 n(1-p2) = (123)(1 - 0.2764) = 89 > 10
6.
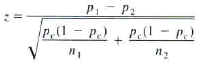
7. z = 1.763706942
8. p = 0.0388906195
9. We reject the null hypothesis at the 0.05 level of significance because the p-value was less than the alpha. Therefore, there is sufficient evidence to suggest that the true proportion of students at North Olmsted High School that use iPhones is GREATER than the true proportion of students at North Olmsted High School that use Androids.
Chi-Squared Test
Is there a relationship between gender and phone type at North Olmsted High School?
2. Ho: There is no relationship between gender and phone type.
3. Ha: There is a relationship between gender and phone type.
4. α = 0.05
5. Assumptions: All expected cell counts are greater than 5 and the sample is random.
Expected Matrix:
| 23.79 | 23.21 |
| 17.21 | 16.79 |
6.

7. X² = 0.9903083885
8. p = 0.3196670134
9. We fail to reject the null hypothesis at the 0.05 level of significance because the p-value was greater than the alpha. Therefore, there is insufficient evidence to suggest that there is a relationship between gender and phone type at North Olmsted High School.
Click here to see the raw data.
Click here to see the graphs.