The Study:
For out hypothesis test, we chose a 2-Sample T-Test because we compared two sample means for the GPAs of students participating in athletics and students not participating in athletics. We conducted an observational study.
µ1 = The true average GPA of students at North Olmsted High School who participate in Athletics.
µ2 = The true average GPA of students at North Olmsted High School who do not participate in Athletics.
Null Hypothesis:
Ho: µ1 - µ2 = 0
Alternative Hypothesis:
Ha: µ1 - µ2 > 0
Level of Significance:
alpha = .05
Assumptions:
This test is a simple random sample. The sample size for yes is 42 and for no is 29. The Central Limit theorem applies for the Yes column, but not for the No column. A boxplot of the No column shows it to be normally distributed so Yes and No columns are normally distributed. This boxplot can be found on the Graphs page.
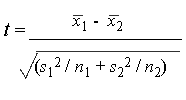
Test Statistic: 2-Sample T-Test
Results from the TI-84 2-SampTTest:
µ1 > µ2
t = 2.619630798
p = .0059743963
df = 45.10930619
p-value:
p = .0059743963