Graphs
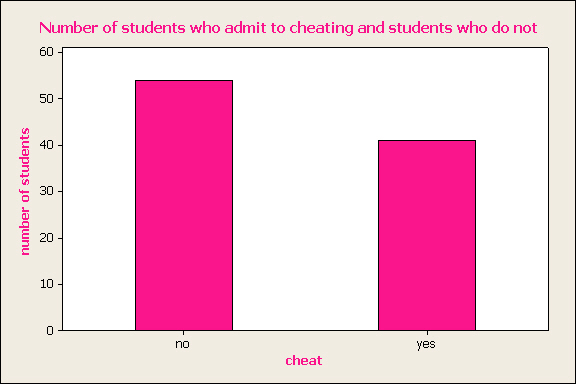
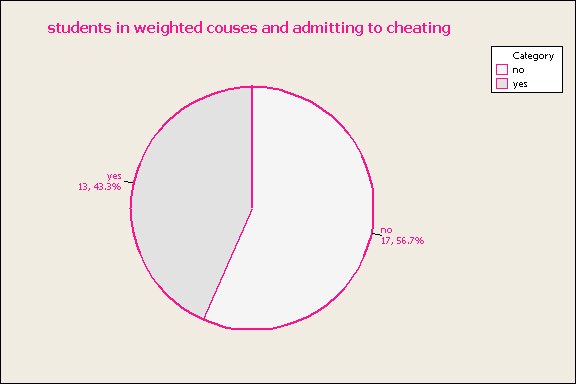
The first set of stats shows the counts precentages for resonses yes and no for the raw data. Thes precentages are used to get the propotions for the first test. the second set shows the counts and presectages for only those who are in weighted couses. The precentages are used to get the propotions for the second test.