Sampling: The population of interest in this study was all students at North Olmsted High School. A random sample of 125 North Olmsted High School Students was obtained. First, a list of all North Olmsted High School students was obtained from Mrs. Caso. Next, the list was entered into the Minitab program. Then, calc->random data-> sample from columns was used to select 125 students. The list was alphabetized and the selected students schedules were obtained through the main office. A class period, teacher and room number was recorded for each student. A sticky note was used to lable the survey with the relevent information. Students were asked to remove the sticky note after completing the survey. After being labled the surveys were distubuted to students through the main office. When the samples were returned the data from the sample was entered into Minitab.
Here is a copy of our survey:
HGEM
Have you ever cheated on an assignment or test while at NOHS?
Circle one:
yes no
Are you in at least one weighted course (honors or AP)?
Circle one:
yes no
To maintain confidentiality, please remove the post-it note when finished.
![]()
![]()
Significance tests :
π = the
true proportion of high school students at NOHS who admit to
cheating
Ho:
π = 0.5
Ha: π > 0.5
α = 0.05
Assumptions: The sample
is random.
np = 95(.5) = 47.5
n(1-p) = 95(1-.5) = 95(.5) = 47.5
np and n(1-p) are both greater than 10. Population standard
deviation is not known, so a 1-proportion t test must be used.
Test-statistic:
 =
-1.12
=
-1.12
p-value = 0.868
Conclusion: We
fail to reject null hypothesis at the 0.05 level of significance
since our p-value of 0.868 is greater than alpha. Therefore, we do
not have sufficient evidence to say that the proportion of high
school students at NOHS who admit to cheating is greater than 0.5
π1
=
the true proportion of high school students at NOHS in all general
classes who admit to cheating
π2
=
the true proportion of high school students at NOHS in at least one
weighted course who admit to cheating
π1
- π2
= the true mean difference between the true proportion of high
school students at NOHS in at least one weighted course who admit to
cheating and the true proportion of high school students in all
general classes who admit to cheating
Ho: π1
– π2 = 0
Ha: π1
– π2
≠ 0
α = 0.05
Assumptions: The
samples are independent and random.
For π1:
np = 65(0.430769) = 27.1000
n(1-p) = 65(1-
0.430769) = 65(.569231) = 37
For π2:
np = 30(0.43333) = 13
n(1-p) = 30(1-
.43333) = 30(.56667) = 17
np and n(1-p) for
both samples is greater than 10.
Test-statistic:
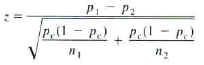 =
-0.02
=
-0.02
p-value = 0.981
Conclusion: We
fail to reject the null hypothesis at 0.05 level of significance
since our p-value of 0.981 is greater than alpha. Therefore, there
is insufficient evidence to suggest that the proportion of students
that admit to cheating and are in at least one weighted course at
NOHS differs from those who are not.