Sampling and Population
The population that the data was taken from was all student athletes who attend North Olmsted High School. The students were then seperated into two groups, boys and girls. From there, 300 students, half girls and half guys, were randomly chosen from Minitab and all of those students recieved a survey. Of the 300 survey sent out, I recieved 186 surveys back, out of which there were 75 athletes. These are the results that I found.
Survey
|
Circle one |
Circle one |
Circle one MN |
|
Are you an
athlete? (play a sport at
NOHS) |
Are you a boy or
girl? |
Do you prefer
Nike, Adidas, or Under Armour? |
|
Y
N |
Boy
Girl |
Nike Adidas Under Armour |
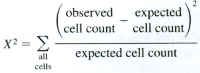
Chi-Square Test
The question investigated was: Is there a relationship between gender and preference in Nike, Under Armour, or Adidas?
Ho: There is no relationship between gender and
preference in Nike, Under Armour, or Adidas.
Ha: There is a relationship between gender and
preference in Nike, Under Armour, or Adidas.
α = 0.05
Assumptions: All expected cell counts are greater than 5 and the sample is random.
Expected Matrix:
4.587 34.400 4.013
3.413 25.600 2.987
 =
0.950; p = 0.622; DF = 2
=
0.950; p = 0.622; DF = 2
Conclusion: We fail to reject the null hypothesis at the 0.05 level of significance because the p-value was greater than the alpha. Therefore, there is insufficient evidence to suggest that there is a relationship between gender and preference in Nike, Under Armour, or Adidas. However, there were 4 cells with expected counts less than 5, therefore, are assumptions are not true so the conclusion is not valid.