The Study
Sampling
Our sample size was a random sample of 100
North Olmsted High School students.
We acquired a list of all the students at North Olmsted High
School which contained a total of
1337 students.
Our population was all students at North Olmsted High School.
This list of student names was placed into minitab and a
random sample of 100 was determined.
After this, we looked up schedules and sent out surveys to a
convenient period. A
few students were unable to be included due to schedule conflicts.
Of the 100 surveys we sent out, we received 62 back, so this
was our sample. The
data from last year was based upon the entire student population,
based upon about 1500 students.
Survey
How many days have you been tardy to school in
the first three quarters of this school year? _____
How many days have you been absent in the first
three quarters of this school year? _____
![]()
![]()
Significance Test
1.
µ1= the mean number of
tardies per student in North Olmsted High School during the first
three quarters of the 2012-2013 school year
µ2=
the mean number of tardies per student in North Olmsted High School
during the first three quarters of the 2013-2014 school year
2.
H0 : µ1 =µ2
3.
Ha: µ1 < µ2
4.
α=0.05
5.
t=
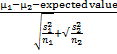
6.
Assumptions: Samples are independent
and random. Samples are
large enough, n1=1500>30, n2=62>30 so the
Central Limit Theorem applies.
7.
T= -2.147384847 at 61.58553468 df
8.
P-value= 0.0178534634
9.
Conclusion: We reject the null
hypothesis at the 0.05 level of significance because p-value<α.
Therefore there is sufficient evidence to say that the mean
number of tardies per student in North Olmsted High School during
the first three quarters of the 2012-2013 school year was less than
for the 2013-2014 school year.