Background Research
Our study that we are conducting is to see if the proportion of students at NOHS who have an Iphone is larger than the proportion of students who have an Android device. A few variables in our experiment that we aren’t able to control are the non- response bias and the demographic characteristics. We sent surveys out to more than 10% of our population ecting to get less back because of this non-response bias. One demographic characteristic that can change our data is that Iphones tend to be more expensive than Android's, this could lead to a higher proportion of Androids in our study because we are not in a very affluent area. Also education levels seem to have a say in which phone you own, people who have a higher level of education seem to own Iphone’s. Since our population isn’t very educated we will probably see a higher proportion of Androids in our school.
We couldn’t find a study exactly like ours but there are many that are similar to ours. One such study is “How Iphone and Android Ownership Varies by Demographic”. I got this site by googling Iphone vs. Android.<m.marketingprofs.com/charts/2013/10957/how-iphones-and-android-ownership-varies-by-demographic>. This study was published by Ayaz Nanji in 2013. His population for this study was of 2,076 cell phone owners from Pew Research Center’s Internet & American Life Project. Ayaz wanted to see if there was a widely different ownership ratio across demographic groups. He found that cell phone owners over a broad range of educational and income levels have similar levels of android adoption, but the people on the upper end of those spectrums were much more likely to own an Iphone. Ayaz also concluded that the younger demographic owned androids over IPhones.
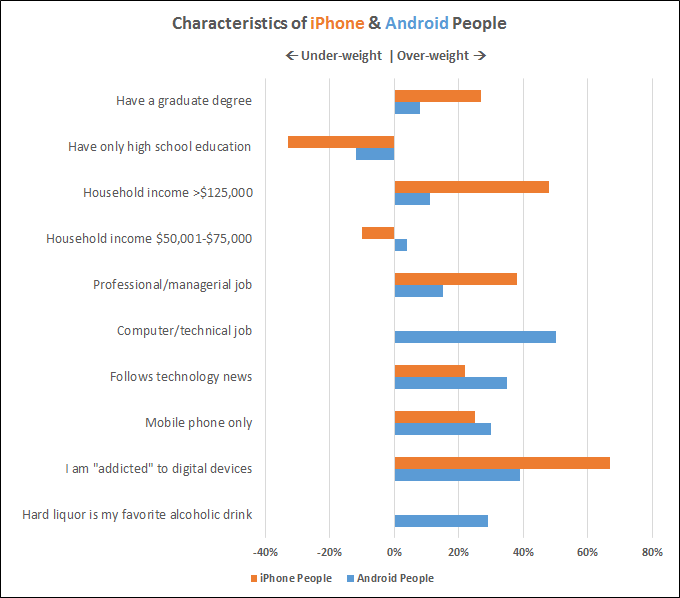
Another study that pertained to ours was “What Kind Of Person Prefers An IPhone?”. In this study Todd Hixon was trying to find the differences of people who prefer an IPhone and of the people who prefer an android. I chose this study because it could be very helpful to our study in finding different variables that could change the outcome and being able to explain why. Hixon started his study by going to CivicScience, this site constantly runs surveys on hundreds of websites, asking questions about products and preferences. This site has a database of over 300 million responses from about 27 million people. Hixon started looking for trends as to why people picked their phone to show which characteristics of people who prefer each product. The graph below shows his conclusion, during his study Hixon found that the more educated people of the population prefered Iphones, and the more affluent of the population owned Iphones. Hixon found little to no correlation with age and choice of phone. In conclusion this data showed that android people include more hardcore techies and work in more technical jobs, they are also less affluent. On the flip side Iphone people are a notch higher on the socio-economic scale, higher income and education. They are more of a tech enthusiast and consumers rather than producers. His study is found here: <http://www.forbes.com/sites/toddhixon/2014/04/10/what-kind-of-person-prefers-an-iphone/#2afbde453e5a>

Even though we couldn’t find any research or study that was exactly like our experiment, there were many other studies that were similar to ours. With Ayaz Nanji and Todd Hixon’s research, there was no conclusion that can be drawn that will help assist with our study, because most of these studies that we found were solely looking at the reasons why the proportion were the way that they were, not just the proportions themselves. The data we found in each of these studies will help us come to