Lunch Preference vs. Gender
The Study
Sampling
For my study, the population of interest would be the entire student body of North Olmsted High School. The students chosen could be from any grade level or of any gender. My samples were obtained by assigning the entire student body a number. Then, by using a random number generator, I obtained, a sample of 150 students for my sample size.
I decided to have a sample size of 150 students to reduce the amount of response bias being that some students might not return the surveys, they misplaced, or some of students go to Polaris.
Survey:
Please check which option applies to you.
Do you have a lunch period this year? Yes____ No_____
What is your gender? Male____ Female ____
On average which do you do most often? (Check one only please)
Pack a lunch from home ____ Buy a school lunch _____ Don’t eat a lunch _____
Tally for Discrete Variables: Lunch, Lunch2
Lunch Count Percent Lunch2 Count Percent
1 26 52.00 1 27 52.94
2 24 48.00 2 24 47.06
N= 50 N= 51
Test and CI for Two Proportions
Sample X N Sample p
1 24 78 0.307692
2 24 72 0.333333
Estimate for p(1) - p(2): -0.0256410
95% CI for p(1) - p(2): (-0.175131,
0.123849)
Test for p(1) - p(2) = 0 (vs not = 0): Z =
-0.34 P-Value = 0.737
Significance Test
Ho:π1-π2=0 The proportion of females over the proportion of males pack more lunches.
Ha:π1-π2>0 The proportion of females over the proportion of males don't pack more lunches.
Significance level:α= 0.05
Assumptions: The samples are independently chosen random samples.
Both sample sizes are large.
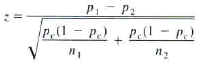
Calculation:
z= -0.034
p=0.737
Conclusion: We can fail to reject the null hypothesis at the 0.05 level of significance because the p-value is greater than alpha 0.05. Therefore we have insufficient evidence to say the proportion of females who pack a lunch is greater than the proportion of males who pack a lunch.