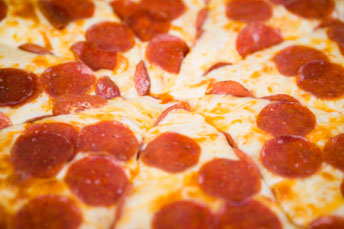
We have found several websites on research related to pizza toppings. We searched pizza topping preferences for both children and adults. Also, there were websites that had results from polls on pizza topping preference. We found that 62% of Americans prefer meat toppings on their pizza, while 38% prefer vegetarian toppings. We also found that America’s favorite pizza topping is pepperoni and it is approximately 36% of all pizza orders. Americans eat approximately 251,770,000 pounds of pepperoni per year. Once we discovered this information, we decided to compare the proportions of ages of people who prefer pepperoni as their favorite topping. We decided to pick the most popular topping so that we could have large proportions to compare in our studies. Some of the other popular pizza toppings are extra cheese, mushrooms, sausage, green peppers and onions. This website was very useful in the fact that it seems to have very valid information. We also found other website that had the same statistics as this website. This website cited its sources where it got its data from, which makes us think that it is more valid than the information we got from other websites. http://www.wisdairy.com/SpecialOffers/AmericasDairyLand/episode/pizzacheese/
favoritepizzatoppings.aspx
http://www.pizzaware.com/facts.htm
We also found a website which compared the brands of pizza that has the most pepperoni, which shows that other studies have been down on pizza toppings. This website also gave us the idea that if did a taste testing of pizza, it would be best to stick with one brand for all different types of toppings. This would eliminate the extraneous factor of brand type affecting the outcome of preferred pizza topping.
http://www.mercer.edu/camps/message/summer2000/summer2000-pizza.htm
With this information we decided that on our survey we would list all this toppings for people to choose as their favorite. We are going to take the proportion of those who prefer pepperoni and compare portions of students versus proportion of teachers. We found an online poll about pizza topping preference; the poll showed that overall 41% of people of the 43 people who responded preferred pepperoni on their pizza. When we broke this percentage down by age 60% of people ages 13-17 preferred pepperoni on their pizza. We found that the percentage of adults between 31-40 was also 60%. However, in viewing this information we saw double amount of children responded to the poll than adults, so the actual proportions may be different. From this information we have decided that the proportion of students would be greater than the proportion of teachers who preferred pepperoni pizza and this would be the alternative hypothesis in our study. This is an invalid because it is an online poll and doesn’t represent any population accordingly. This is because the people who take this poll have to have a computer and have to be looking for this information to take this type of poll. If there was no selection bias, the sample size for the ages would still to small to draw any information from that actual population.