
In our study, our population of interest is the teacher and students of North Olmsted High School. We are interested in studying the proportions of teachers' and students' preferences of pizza toppings. We sampled 60 students and 10 teachers for our sample. To obtain these students for our sample we had a list of every student enrolled in the high school and using Minitab randomly selected 60. We looked up their schedules and sent our surveys to their first available class. We also followed this procedure for the teachers of the high school. We had a list of all the teachers and randomly selected 10 using Minitab. We placed all the surveys in their mailboxes.
Out of the following, choose your 1 favorite pizza topping…
(circle only one)
Extra Cheese Green pepper Pineapple
Onion Pepperoni Bacon
Sausage Mushroom Other:
What grade are you in?
We listed 8 different toppings with an others option and the students and teachers would only circle one. We also had the question of what grade are you in, so that we could determine whether it was a teacher or student that completed the survey.
π1 = The true proportion of students at North Olmsted High School that prefer pepperoni as their favorite pizza topping
π2 = The true proportion of teachers at North Olmsted High School that prefer pepperoni as their favorite pizza topping
Ho: π1 = π2
Ha: π1 > π2
α = .05
Assumptions:
1. The samples are independently chosen random samples
2. Both sample sizes are large
n1p1 ≥ 10 n1(1-p1) ≥ 10 n2p2 ≥ 10 n2(1-p2) ≥ 10
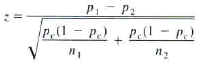
![]()
Z = 0.48
P-Value = 0.315
Our study in inconclusive due to the fact that our teacher sample size was not great enough.
n2p2 ≥ 10
10 (0.2000) ≠ 10
So therefore, our test was not valid.