Study
- The population of interest is the student body of North Olmsted High School. The Sample was derived from a list of every student that attends NOHS with a corresponding number for their alphabetical placement. The list of students was placed into a random number generator through the use of the Minitab program. The program was used to obtain a random list of 100 students to be surveyed for our project. The 100 randomly selected students are the sample to be used and include students from all grades and both genders from the school student list.
2008 NOHS STATS SURVEY LBER
Have you quit a sport anytime after you completed the 6th grade? Please fill in the bubbles of those sports you have quit during or after the season (Injuries, disciplinary action, ineligibility are to be excluded).
O Football O Cross Country
O Soccer O Tennis
O Volleyball O Wrestling
O Basketball O Swimming/Diving
O Hockey O Bowling
O Baseball O Golf
O Softball O Track/Field
O Other O Gymnastics
O None
μ1=the Individual sports
μ2=The Team sports
Ho: μ1=μ2
Ha: μ1 ≠μ2
alpha= 0.05
We used random and independently chosen samples. We can assume normality since students sampled>30 and follows the central limit theorem.
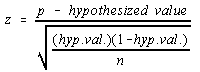
Test and CI for Two Proportions
1 16 57 0.280702
2 23 57 0.403509
Estimate for difference: -0.122807
95% CI for difference: (-0.295516, 0.0499021)
Test for difference = 0 (vs not = 0): Z = -1.39 P-Value = 0.163