Our sampling
process began by compiling a list of names for varsity athletes
at North Olmsted High School, and compiling a list of students
enrolled in a music class at North Olmsted High School. We then
filtered out all of the names of students who fit both
descriptions. Then we entered the names into MINITAB and
randomly chose 60 students for each category using a random
number generator. MINITAB spit out 60 athletes, and 60
musicians, and we sent a total of 120 surveys to these students.
The musicians were given surveys in class by Mr. McMurtrie,
myself, and Mr. Venesile. The athletes were given their surveys
through teacher mailboxes based on the students’ schedules. The
survey had 5 questions. We asked them what their Accumulative
GPA is, their involvement in athletics/music, their study
habits, and about their future plans after high school.
Our null hypothesis is that musicians are
smarter than athletes, and our alternative hypothesis is that
athletes are as smart or smarter than musicians.
Let µ equal the true mean GPA.
µ1=The average GPA of athletes
µ2=The average GPA of musicians
Null Hypothesis: µ1<µ2
Alternative Hypothesis µ1≥µ2
Significance Level: α=.05
Assumptions: The sample is normally
distributed.
Test statistic: 2 Sample T-Test
T Formula:
T value: .9883
P value: .1642
Since our p value is greater than alpha at
.05, we failed to reject the null hypothesis at a significance
level of .05. Therefore, there is insufficient evidence to say
that athletes are as smart or smarter than
athletes.
Our sampling process began by compiling a list of names for varsity athletes at North Olmsted High School, and compiling a list of students enrolled in a music class at North Olmsted High School. We then filtered out all of the names of students who fit both descriptions. Then we entered the names into MINITAB and randomly chose 60 students for each category using a random number generator. MINITAB spit out 60 athletes, and 60 musicians, and we sent a total of 120 surveys to these students. The musicians were given surveys in class by Mr. McMurtrie, myself, and Mr. Venesile. The athletes were given their surveys through teacher mailboxes based on the students’ schedules. The survey had 5 questions. We asked them what their Accumulative GPA is, their involvement in athletics/music, their study habits, and about their future plans after high school.
=======================================================================
Our null hypothesis is that musicians are smarter than athletes, and our alternative hypothesis is that athletes are as smart or smarter than musicians.
Let µ equal the true mean GPA.
µ1=The average GPA of athletes
µ2=The average GPA of musicians
Null Hypothesis: µ1<µ2
Alternative Hypothesis µ1≥µ2
Significance Level: α=.05
Assumptions: The sample is normally distributed.
Test statistic: 2 Sample T-Test
T Formula: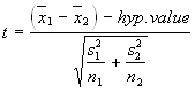
T value: .9883
P value: .1642
Since our p value is greater than alpha at .05, we failed to reject the null hypothesis at a significance level of .05. Therefore, there is insufficient evidence to say that athletes are as smart or smarter than athletes.