The Study
Sampling
For our study, we surveyed a sample size of 80 randomly selected
students from the entire student population of North Olmsted High
School. The students were randomly selected by a random number
generator in the Minitab program.We created a survey that asked
participants whether they were male or female, preferred dogs or cats,
if the person in question owns a pet, if so, what kind of pet, and how
many pets.
(Below is a text replica of the survey formed that we utilized)
MWPS
Survey
(Please check an “X” in the box of the choice that best describes you)
Gender: □ Male
□ Female
If you own a pet, what kind?---_________________________________
How many?_______________________________________________
Preference: □ Dog Person
□ Cat
Person
(Regardless of what you actually have)
Significance Test
H0: There is no association
between gender and preferred pet.
Ha: There is an association
between gender and preffered pet.
α = 0.05
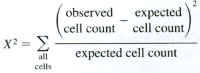
Assumptions: Our sample size is large enough because all expected cell
counts are 5 or more. The chi-squared can be used because we used
independent random samples in our study.
|
Tabulated statistics: GENDER, ANIMAL
Rows: GENDER Columns: ANIMAL
C D All
F 10 26 36
8.73 27.27 36.00
M 6 24 30
7.27 22.73 30.00
All 16 50 66
16.00 50.00 66.00
Cell Contents: Count
Expected count
Pearson Chi-Square = 0.539, DF = 1, P-Value = 0.463
Likelihood Ratio Chi-Square = 0.544, DF = 1, P-Value = 0.461 |
Conclusion: We failed to reject the null hypothesis at the 0.05 level of significance because the p-value > α. Therefore, there is not sufficient evidence to say that there is a correlation between gender and pet preference. |