Study
-
Ho: There isn’t a difference in the number of social media accounts per person per grade level.
Ha: There is a difference in the number of social media accounts per person per grade level.
2. Alpha: 0.05
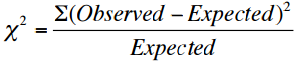
3.
4. Assumptions: the random samples were independently chosen, so use of the test is appropiate. Although the sample isn't large enough since four cells are less than five, we will continue with the test
5.
8.378 7.733 6.767 6.122
15.022 13.867 12.133 10.978
2.600 2.400 2.100 1.900
Expected count
Likelihood Ratio Chi-Square = 3.789, DF = 6, P-Value = 0.705
6. Df=6
7. P-value= 0.705
Study
We conducted our sample by using a simple random sample by using a list of all of the students in our high school. Our population of interest was all students at NOHS. Our data was also categorical. We took all of the names and placed them into Minitab and used it to randomly choose 30 students from each grade level so in the end we sent out a total of 120 surveys. Out of those surveys we got back 90 of those surveys. We received 26 surveys from freshman, 24 from the sophomores, 21 from the juniors, and from 19 juniors.
AP Statistics Survey
-
What grade level are you in (circle one)?
9 10 11 12
2. How many social media accounts do you have? (include forum accounts, not blogs)
____________