


Ice Cream Study
Sampling
Our sampling was obtained by a random generator on MINITAB using the names of the entire student body of North Olmsted High School students. Our population of interest was every student who attends North Olmsted High School. Our sample consists of students from every grade level, ninth through twelfth, with the exception of two eighth graders who are taking high school classes. We wanted to have a sample study of 150 students, 75 of each gender. From the list we obtained, we stratified the list by gender. Using Minitab we conducted a sample from the columns to get the random list of student names. Then we put that list into alphabetical order. Then we went to the main office to list a period and a place to give each student their survey. We put a sticky note with all the information on top of the survey and gave them to Mrs. Caso to distribute to each teacher’s mailbox. Unfortunately due to students being in Polaris full time and being in PSOP we were unable to send out every survey. So we sent out 69 surveys to males and 74 surveys to females. After sending the surveys out, some got sent back either unable to be filled out, filled out wrong or not completely, or the student no longer is in that class anymore. We stratified our sample by gender, but then obtained a random sample of the names by using MINITAB.
Survey Example
2.What grade are you in? Circle one:
3.Which ice cream topping would you prefer? Circle one:
Graphs and Data
![]()
![]()
Significance Test
Two-Proportion Z-Test
π1= the true proportion of males who prefer chocolate topping
π2= the true proportion of females who prefer chocolate topping
Ho: π1 = π2
Ha: π1 < π2
α = 0.05
Assumptions: Since pn>10 and n(1-p)>10, the data is normally distributed. the samples are independent and randomly chosen.
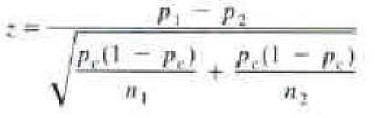
Z = -0.69
P-Value = 0.246
We failed to reject our null hypothesis since the p-value is greater than α.
Two Proportions Test:
Event = male
topping2 X N Sample p
1 24 47 0.510638
2 29 50 0.580000
Difference = p (1) - p (2)
Estimate for difference: -0.0693617
95% upper bound for difference: 0.0966687
Test for difference = 0 (vs < 0):
Z= -0.69 P-Value = 0.246