What do you believe?
We designed and evaluated an observational study in order to see if there was an association between a person's gender and their strength of belief in global warming. Here's how we went about it...
Sampling Procedure
We obtained a list of males and of females of students from all grades at North Olmsted High School from the teacher, opened it up in Minitab, and used the random sample from columns function to get a stratified sample of 50 people per gender to be surveyed. The genders were separated, and for each gender, each student was assigned a random number from 1-how many students there were, with no numbers repeating. We then used the generator to generate 50 numbers per gender. These numbers corresponded to the 50 students per gender who were to participate in the study. They were matched according to number and then sent surveys to their study halls, or other classes if a study hall was not available.
The Students
Out of the 100 surveys we sent out, 63 of them were returned. 29 were from males and 34 females. One female was recorded twice, once as a belief strength of 6 and once as a belief strength of 7 because she circled both. The rest of the surveys either could not be delivered to the student because they were in another class and could not be found in the time of the sampling, or did not return them for unknown reasons.
The Survey
1. On a scale from 1-10, how strong is your belief that global warming is a problem?
Guideline for number scale: 1 = not a problem or don’t know what global warming is 10 = the largest problem society faces today
(Circle one) 1 2 3 4 5 6 7 8 9 10
2. What is your gender? (Circle one)
Male Female
The Significance Test
Ho: There is no association between a person's strength of belief in global warming and their gender. [They are independent]
Ha: There is an association between a person's strength of belief in global warming and their gender. [They are dependent]
α=0.01
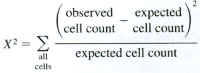
test statistic:
assumptions: 1) The data consists of independently chosen random samples. 2) The sample size is large, meaning all expected counts are at least 5. Although our table did not meet this assumption, as 2 of the cells were less than 5, we proceeded with the significance test anyway in order to have a result. In order to reduce the number of cells less than 5, we put the ratings into 3 groups, with 1-3 in group 1, 4-6 in group 2, and 7-10 in group 3.
X²= 9.297
df= 2
p-value= 0.010
We can reject the null hypothesis at the 0.01 level of significance because the p-value is less than α. Therefore, we have sufficient evidence to support the claim that there is an association between a person's strength of belief in global warming and their gender.
The Two-Way Table Chi-Square Test
The test statistic that we used in our chi-square test for independence was...
Tabulated statistics: Gender, groups
Rows: Gender Columns: groups
1 2 3 All
F 1 8 26 35
4.92 8.75 21.33 35.00
M 8 8 13 29
4.08 7.25 17.67 29.00
All 9 16 39 64
9.00 16.00 39.00 64.00
Cell Contents: Count
Expected count
Pearson Chi-Square = 9.297, DF = 2, P-Value = 0.010
Likelihood Ratio Chi-Square = 10.052, DF = 2, P-Value = 0.007
* NOTE * 2 cells with expected counts less than 5
