The Study!
Our Sample
We decided to conduct a survey of a random sample of 100 students at our population of interest, North Olmsted High School. Since we are conducting the survey based on gender, we used stratified sampling and chose 50 female students 50 male students. We used MINITAB to randomly select the students from a list provided by the teacher of every student, which we separated by gender. Our sample of students range in grade level from nine through twelve, with the exception of one eighth grader who attends class at the high school. Once we generated our list, we looked up each students schedule individually to find when to distribute our survey to each student. We distributed most of our surveys with the exception of students who attend Polaris or PSEOP full time. After sending the surveys out, we received 72 surveys that we could use due to students not being present in the class, students no longer being in the class, or students who filled out the survey wrong. Below is a copy of the survey we sent out.
- What is your gender? (circle one)
Male Female
- What movie genre do you most prefer? (circle ONLY ONE)
Horror Drama Comedy Romance
Romantic Comedy Action Family Films Sports
Musicals Sci-Fi
The Chi-Squared Test
We chose this test because of the catergories of our study would best result with the test seeing as we have used gender and then broke it down into a few different categories. We conducted this test so we could make sure there was actually an association between gender and genre and that the data we collect could be assumed correct.
Null hypothesis: There is not an association between gender and movie genre preference
Alternative hypothesis: There is an association between gender and movie genre preference
Assumptions: random sample, independent
*ONE CELL COUNT DOESN'T HAVE THE NEEDED 5 OR MORE VALUE, BUT THERE WAS NO FIXING IT BECAUSE NO FEMALES CHOSE ACTION AS A CHOICE FOR THE STUDY.
alpha: 0.05
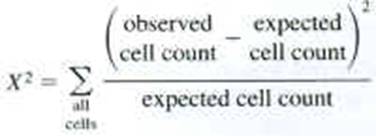
Test Statistic:

3.69 16.89 6.33 11.08 38.00
3.31 15.11 5.67 9.92 34.00
7.00 32.00 12.00 21.00 72.00
Expected count
Likelihood Ratio Chi-Square = 13.801, DF = 3, P-Value = 0.003
X2 = 11.002
P-value = 0.012
DF = 3
Since our p-value, 0.012, is less than alpha, we can reject the null hypothesis at the 0.05 level of significance. Therefore, we have sufficient evidence to conclude that there is an association between gender and movie genre preference.
female 38 52.78 action 7 9.72
male 34 47.22 comedy 32 44.44
N= 72 drama 12 16.67
horror 21 29.17
N= 72