Here is an copy of the study I randomly sent out to students in North Olmsted:
Which hand do you predominantly use?
L R
On a scale of 1 to 5, with 1 being very liberal and 5 being very conservative (3 being neutral), where would you place yourself on this number line?
1 2 3 4 5
2 Proportion Test
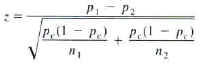
For my study, I chose to do a 2 Proportion hypothesis z-test. This is because I have a sample proportion of right handed people with their political preferences and left handed people with their political preferences. I am running this test to identify any correlations betweeen handedness and political preference.
The left hand test follows these steps:
1) null: Proportion of liberals=Proportion of conservatives
2) alternative:Proportion of liberal > proportion of conservative
3) alpha=0.05
4) z-score=
5) assumptions
a) np>10
b) n(1-p)>10
c) random sample
6) Minitab Results:
Test and CI for Two Proportions
Sample X N Sample p
1
11 11 1.000000
2
0 11 0.000000
Difference = p (1) - p (2)
Estimate for difference: 1
95% CI for difference: (*, *)
Test for difference = 0 (vs not = 0): Z = * P-Value = *
Fisher's exact test: P-Value = 0.000
* NOTE * The normal approximation may be inaccurate for small
samples.
7) p-value=0
The Right hand test follows these steps:
1) null: Proportion of liberals=Proportion of conservatives
2) alternative:Proportion of liberal < proportion of conservative
3) alpha=0.05
4) z-score=
5) assumptions
a) np>10
b) n(1-p)>10
c) random sample
6) Minitab Results:
Test and CI for Two Proportions
Sample X N Sample p
1
8 43 0.186047
2
9 43 0.209302
Difference = p (1) - p (2)
Estimate for difference: -0.0232558
95% upper bound for difference: 0.117957
Test for difference = 0 (vs < 0): Z = -0.27 P-Value = 0.393
Fisher's exact test: P-Value = 0.500
7) p-value=0.393
To see the raw data and graphical displays of the results, look at these links:
-Relevant Discriptive Statistics and Graphs
Comments (5) . 05 Jan 2007 . 10:37