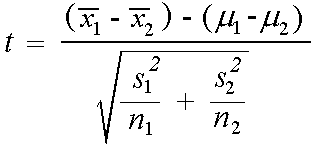
We obtained the list of the 100 students we surveyed at North Olmsted High School by computer randomization. Our population of interest is all of NOHS, and we used a sample size of 100 students to extrapolate to the population. Our sample includes random students from grades 9-12. We used Minitab to generate the sample of students from the list of the high school’s entire population. The type of test we ran was a 2 sample mean t-test, and this was chosen because we weren’t dealing with a population, therefore could not use a z-test. Also, we were comparing the means of two seperate variables so we used a 2 sample mean t-test.
The Survey:
What is your current cumulative GPA?
What is your natural hair color? check one of the below options.
__ Blond __Brown __Black __Red
Hypothesis Test:
U1=the true mean GPA of naturally blond students at North Olmsted High School
U2=the true mean GPA of students at North Olmsted High school who do not have naturally blond hair
Ho: U1-U2=0
Ha: U1-U2<0
a= 0.05
Assumptions:
Samples are independent and random.
The population is normally distributed.

t=1.86
p-value=0.960
Minitab Output:
Two-Sample T-Test and CI: Blond, Not Blond
Two-sample T for Blond vs Not Blond
N Mean StDev SE Mean
Blond 10 3.400 0.540 0.17
Not Blond 49 3.014 0.829 0.12
Difference = mu (Blond) - mu (Not Blond)
Estimate for difference: 0.386
95% upper bound for difference: 0.746
T-Test of difference = 0 (vs <): T-Value = 1.86 P-Value = 0.960 DF = 18