Math Portal
Introductory Statistics
Section 4.2 continued - Patterns to look for in
scatter plots.
Page 1 - Page 2 - Page 3 - Page 4
Data Correlation.

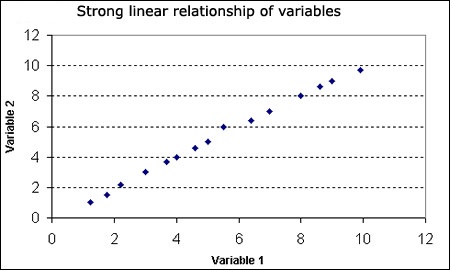
Figure 5. When the data points form a straight line on the graph, the linear relationship between the variables is stronger and the correlation is higher.
Positive or direct relationships.

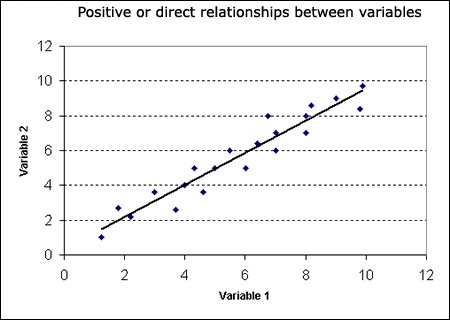
Figure 6. If the points cluster around a line that runs from the lower left to upper right of the graph area, then the relationship between the two variables is positive or direct. An increase in the value of x is more likely associated with an increase in the value of y. The closer the points are to the line, the stronger the relationship.
Negative or inverse relationships.

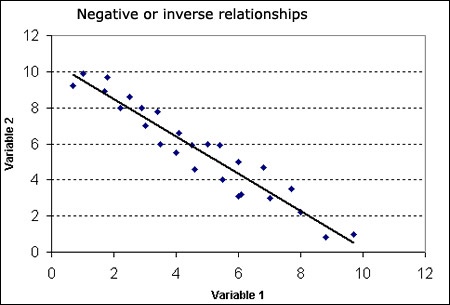
Figure 7. If the points tend to cluster around a line that runs from the upper left to lower right of the graph, then the relationship between the two variables is negative or inverse.
Scattered data points.

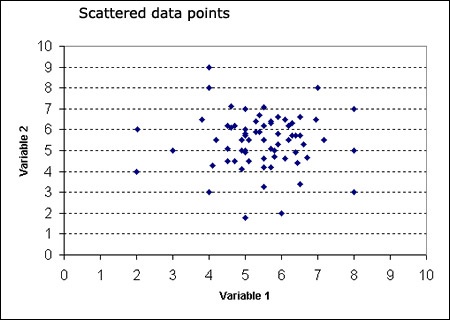
Figure 8. If the data points are randomly scattered, then there is no relationship between the two variables; this means there is a low or zero correlation between the variables.
Click here to continue to the next page
Page 1 - Page 2 - Page 3 - Page 4
Data Correlation.

Figure 5. When the data points form a straight line on the graph, the linear relationship between the variables is stronger and the correlation is higher.
Positive or direct relationships.

Figure 6. If the points cluster around a line that runs from the lower left to upper right of the graph area, then the relationship between the two variables is positive or direct. An increase in the value of x is more likely associated with an increase in the value of y. The closer the points are to the line, the stronger the relationship.
Negative or inverse relationships.

Figure 7. If the points tend to cluster around a line that runs from the upper left to lower right of the graph, then the relationship between the two variables is negative or inverse.
Scattered data points.

Figure 8. If the data points are randomly scattered, then there is no relationship between the two variables; this means there is a low or zero correlation between the variables.
Click here to continue to the next page