Math Portal
Introductory Statistics
Section 4.2 continued - Patterns to look for in scatter plots.
Page 1 - Page 2 - Page 3 - Page 4
Non-linear patterns.

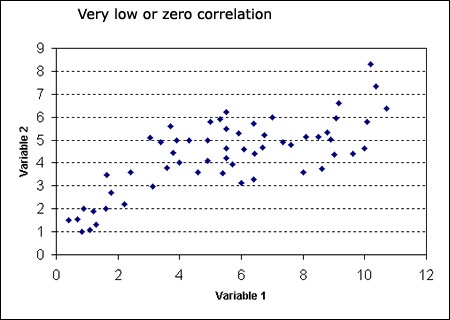
Figure 9. Very low or zero correlation may result from a non-linear relationship between two variables. If the relationship is, in fact, non-linear (i.e., points clustering around a curve, not a straight line), the linear correlation coefficient will not be a good measure of the strength of the relationship.
Spread of Data.


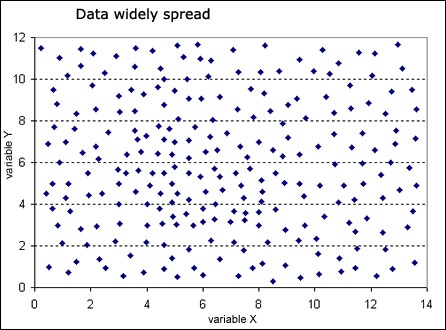
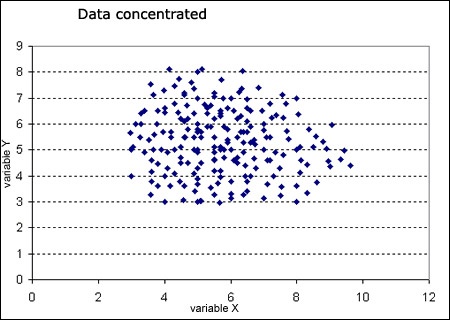
Figure 10. A scatterplot will also illustrate if the data are widely spread or if they are concentrated within a smaller area.
Outliers.

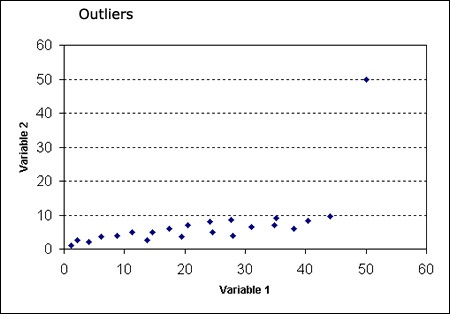
Figure 11. Besides portraying a non-linear relationship between the two variables, a scatter plot can also show whether or not there exist any outliers in the data.
Scatter plots that show linear relationships between variables can differ in several ways including the slope of the line about which they cluster and how tightly the points cluster about the line. A statistical measure of the strength of the relationship between two quantitative variables that takes these factors into account is the subject of the section Correlations and Their Coefficients.
Page 1 - Page 2 - Page 3 - Page 4
Non-linear patterns.

Figure 9. Very low or zero correlation may result from a non-linear relationship between two variables. If the relationship is, in fact, non-linear (i.e., points clustering around a curve, not a straight line), the linear correlation coefficient will not be a good measure of the strength of the relationship.
Spread of Data.


Figure 10. A scatterplot will also illustrate if the data are widely spread or if they are concentrated within a smaller area.
Outliers.

Figure 11. Besides portraying a non-linear relationship between the two variables, a scatter plot can also show whether or not there exist any outliers in the data.
Scatter plots that show linear relationships between variables can differ in several ways including the slope of the line about which they cluster and how tightly the points cluster about the line. A statistical measure of the strength of the relationship between two quantitative variables that takes these factors into account is the subject of the section Correlations and Their Coefficients.